Llevaba un año trabajando en la bolsa cuando me tragué el crash de octubre de 1987. Insólito. No lo esperaba nadie, no como ahora que mucho se había escrito recientemente sobre su repetición. Pero es que antes de 1987 nunca había pasado y se pensaba que nunca podría ocurrir. Para mi, un pipiolo de 23 años, me supuso una verdadera angustia… ¿Qué era esto de que la bolsa, en su equilibrio inestable habitual, pudiera derrumbarse sin previo aviso un apabullante 22,61% en un día?
Mayores bajadas del DOW JONES en un día:

Desde entonces, y tras 30 años de trabajo en banca privada, he aprendido muchas lecciones. Cuidado con las decisiones que se tomen hoy. Cuidado con lo que se hace, ya que la angustia dura lo que dura, y el dinero tiende a volver a fluir a los mercados. Nadie quiere que un batacazo en bolsa derive en una crisis más profunda.
Mira lo poco que se ve el crash del 1987 en una tendencia de largo plazo (aunque coincidió que los años de después fueron los de la enorme ganancia en productividad por la utilización masiva de los ordenadores, y luego la eficiencia por el uso masivo de Internet. ¿Qué habrá ahora que haga que suba con fuerza el mercado, las FANGs? Lo dudo… ¿China? Seguro que sí…):

Sí, pilla muy mal a los bancos centrales, grandes culpables por su patada adelante desde la crisis de 2008, de estos males de hoy. Tanto dinero, tanta emoción de Trump por lo bien que iba la bolsa, parece que se gobierna para que la bolsa suba… Pero les queda poco músculo a los bancos centrales para ayudar en nada. Ese “Wathever it takes” de Draghi ahora no podrá hacer nada… Y la FED podría perder los papeles (su credibilidad) por completo… La confianza del sistema se basa en la capacidad de repago de las deudas que no se si tiene por completo…
Es un problema de expectativas, de valoraciones, de tipos de interés y de rendimientos de los bonos, de inflación, de flujos de dinero, esto es lo que mueve a los mercados que suben peldaño a peldaño y bajan como si estuvieran en un tobogán…, hasta que alguno de los grandes inversores decide que la caída ha sido demasiado elevada y opta por comprar y frenar esto…
Y habrá rebotes, cuando se cae de forma muy vertical hay rebotes muy verticales, los llamados “rebotes del gato muerto” que sirven para hacer caja, en el caso de angustia total, y que es mucho mejor que cuando el mercado anda desaforado…
Uncertainty is creeping back in the asset markets. In the US, the stock market volatility is staging a comeback. The yields of the long-term bonds are rising and the yield curve has flattened. On Friday, the stock markets were under heavy selling with the Dow Jones Industrial average suffering one of the worst one-day point declines in its history. Looking back, we find disturbing similarities with the period just before the biggest single-day stock market crash in history: the Black Monday in 1987.
The timeline of the crash
Before crashing in 19 October 1987, the stock markets were beating records. The bull market started in August 1982 and raged through the ‘Roaring Eighties’. The upward momentum was driven by fast economic growth, by the extensive growth of corporate profits, by the influx of new institutional investors which increased the demand for stocks and by tax breaks for mergers and buyouts. Although the interest rates were somewhat high (the federal fund rate was 7.5 %), they had much decreased since summer 1981 (around 19 %). Compared with the 1970s, inflation was actually low. It was the Goldilocks period of that time. Complacency took hold.
In early summer 1987 something changed. The interest rates started to rise. Doubts about the virility of the economic expansion started to linger during the fall. The growing trade deficit of the US and the declining value of the dollar raised concerns about inflation and the need for higher interest rates. Uncertainty was increasing.

On the 14th of October, the stock markets started to fall. It was first fueled by the rumors of the elimination of tax benefits associated with the financing mergers and the announcement that trade deficit was well above the expectations in August. The dollar declined further. On Thursday, the decline in the stock market continued. The institutional investors were getting anxious and started to transfer funds from stocks to bonds.
On Friday, the decline in the stock markets started to gain speed. During the previous two days, the price movements had eliminated many of the at-the-money options, which lead to difficulties for investors to hedge their positions. They looked for shelter by selling future contracts. The heavy selling of the futures contracts created a price discrepancy between the value of the stock index in the futures market and the New York Stock Exchange (NYSE). At the close, S&P 500 was down nine percent for the week, which was one of the largest declines during the past decades.
On Monday, the 19th of October, a substantial selling pressure build up for the NYSE at the open. This delayed the opening of trading for the first hour, which made the NYSE index stale. By contrast, the market for futures opened on time to heavy selling. A large gap between the values of the stock indexes in the cash versus the futures markets evolved. When the stocks opened, prices fell promptly. The index arbitragers observed that they had sold stocks below their expectations and tried to cover their positions by buying in the futures market. This induced a temporary rebound of the prices increasing the confusion among the traders. The portfolio insurer models prompted them to resume sales. They sold both in the cash and futures markets. The cascade of sales overwhelmed the short rally and the markets crashed. At the close, S&P 500 had lost (around) 20 % of its value.
Response
Before the opening of the markets at the 20th, the Federal Reserve issued a statement that it will “serve as a source of liquidity to support the economic and financial systems”. Around seven percent of stocks were closed for trading. The margin payments were cleared before opening. The corporations started to announce stock buyback programs already on Monday, but the critical mass to make an effect on the stock markets was formed only on Tuesday. A small rally evolved at the end of Tuesday trading and carried on for Wednesday.
History can rhyme
The stock markets have been pushing higher for several years and interest rates have been very low for an extensive period of time but are now trending upwards. The dollar has fallen, the US trade balance is negative, economic growth has been sound but doubts about it are starting to linger and the inflation expectations are rising. Corporate profits have also recovered strongly from a previous slump. All these developments preceded the 1987 crash.

Corporate profits before tax in the US, Q1 1983 – Q4 1987 versus Q4 2012 – 2017 Q3. Source: GnS Economics, Fed St. Louis
In addition, this rally has also seen an increase in the program trading, but in much bigger numbers than before the crash in 1987. One big difference is the valuation level, which was more moderate in the 1980s. And, although it cannot be used as an indicative sign, last week’s stock market performance bears some eerie similarities with the week that preceded the Black Monday.
The Fed and the algos: a toxic combination
What becomes to the options of the Fed to respond to a similar crash, the things are rather different now. In 1987, the Fed quickly dropped its fund rate to 7 percent from 7.5 and injected reserves to markets. Now, a 50 -basis point cut in the federal fund rate would take the rate back to the range 0.5 – 0.75, which would likely have a very limited effect of the short-term rates. The Fed has also been pumping massive amounts of liquidity in the markets through its QE program. While re-starting the program would surely provide some temporary relief, there is no certainty that it would be enough to stem the panic; moreover so, because the program trading has a much bigger role now than in 1987.
In the 1980s, the main innovation in the program trading was the portfolio insurance, where the computer models were used to optimize the stock-to-cash ratios at various market prices. Most of the portfolio insurers used the futures market, which was likely to increase the downward pressure of the stock prices during the fall. Currently, the automatic trading is much more widespread. It is estimated that around a half of all trading in the US stock markets is executed by algorithms. Also, it is estimated that ETFs, the risk parity funds and the volatility target funds hold some $8 trillion of the so called passive private assets. They have contributed to the uninterrupted upward trend in the equity markets, but their behavior in a large market correction is untested. When a deep enough correction is reached, the algos are likely to start to sell and short the market and the ETFs and other funds will start to lose value en masse. This will turn their passive assets very active to the sell side. When this point is reached, selling in the markets is likely to morph into a rapid crash halted only by the circuit breakers.
To make things more alarming, the global economic situation resembles more the time before the Great Depression than before the crash of 1987. This makes it possible that, if a stock market crash occurs, it will start a path towards a global depression. Thus, after nearly a decade of central bank induced market manipulation, we may finally be closing to the point where the Abyss starts to gaze back at us.
Abrazos,
PD1: Goldman, siempre Goldman…
Goldman's Clients Have Just One Question: Is It Really 1987 All Over Again?
Until last Friday, there was one ominous comparison being thrown around for the stock market: the burst in the S&P for the month of January was the best start to a year going back all the way to the infamous 1987, when the year ended sharply lower despite its own January euphoria.
Now, one week later, there are other, more troubling comparisons to 1987, and specifically that year's "Black Monday" crash. First, from a purely economic perspective, David Rosenberg summarized it best last week noting the sharply "rising bond yields. Full employment. Fed tightening. Trade frictions. Weak dollar. Rising twin deficits, spurred by tax reform. Sound familiar? It should. This was 1987."
Then, last week's widely telegraphed market drop finally happened, one which sent the Dow Jones lower by 1,000 point in the span of 5 days and which with its demonic 666 point plunge on Friday, was also the 6th biggest daily point drop in Dow Jones history.
All of the above appears to have spooked Goldman's clients who - as David Kostin writes in his latest weekly Weekly Kickstart - have one nagging question: is this 1987 all over again.
Despite market volatility this week, the S&P 500 has risen by 3% YTD. The 3.9% decline from last Friday’s close eclipses the 2.8% max drawdown of 2017. Nonetheless, 2018 ranks as just one of 13 years since 1950 to start with a January return greater than 5%. The volatile start of 2018 surprised many investors and caused clients to ask if they should [A] raise their return expectations for the full year, or [B] expect a sharp correction. In particular, investors ask about the likelihood of a repeat of 1987, when a 13% January return and additional 20% rise through August were destroyed on Black Monday, Oct. 19, when the index fell by 20%. The full-year return was 2%
Here Goldman is put in the awkward position of having to defend its year-end price target of 2850, which was briefly eclipsed in the past week, as the S&P was melting up in an unprecedented "blow off top" eruption. So on one hand, Goldman's chief strategist has to explain why he is still bullish, and on the other, why there is virtually no upside left yet why Goldman's clients shouldn't sell their holdings and pack it in for the year. This is how he does it.
In November we described our outlook for 2018 as one of “rational exuberance.” Our expectation was that EPS growth of 14% would lift S&P 500 to 2850 by year-end, but that valuations would remain flat in contrast to the bull market that ended in 2000. With S&P 500 sitting just 3% below our year-end target, significant further appreciation will require either an upward revision to our EPS growth forecast or belief that “irrational exuberance” will lift multiples. The latter scenario would increase the likelihood of a subsequent correction, in our view. Of course, as our colleagues recently noted, a third possibility is that the market suffers a near-term correction before the bull market resumes.
Ok, so, upside is capped because the alternative is a full-blown bubble meltup which will result in a crash. On the other hand, Goldman wants you - its client - to know that a more methodical grind higher should not provoke flashbacks to 1987, preventing it from becoming a sell-fulfilling prophecy as everyone dumps at the same time, something we saw on Friday.
This is how Goldman makes the case that what we saw is not 1987.
Unlike in 1987, the equity market’s YTD rise has been driven primarily by accelerating earnings growth. Record revision sentiment has lifted the consensus bottom-up 2018 EPS estimate by 7% since November. It now stands at $156, representing 18% growth vs. 2017. The bulk of the optimism reflects the incorporation of tax reform into analyst estimates. EPS growth and revisions have contributed all of the S&P 500 YTD return, whereas P/E expansion drove the entire index rise in January 1987.
Goldman then really doubles down, and desperately hopes to reassure you, its skittish client, that not only were there notable differences between 1987 and now, but that other years had just a strong start as 2018 and did not end in a fiery inferno.
By focusing on 1987, investors overlook other historical episodes that suggest a much better outlook for US equities in 2018. Of the 12 other years since 1950 that started with a January return greater than 5%, 1987 is the only one in which the February-December return was negative. Across all episodes, the median 11-month return was 17%

At the risk of pointing out that Goldman is protesting just a little too much, it is perhaps worth asking why are Goldman's clients so eager to compare the current environment to 1987: is it because of all those economic similarities listed by David Rosenberg last week, or because the "muppets" dumb as they may be, realize that without the Fed backstopping this whole charade, the crash that is coming will make 1987 seems like a dress rehearsal.
Ironically, in the very next paragraph Goldman admits that left on their own devices, a crash is inevitable, here's why:
A further market rise is unlikely to stem from valuation expansion. The median S&P 500 firm currently trades in the 99th percentile of historical valuation on a variety of metrics. Although near-record valuations suggest disappointing long-term returns, multiples are typically poor predictors of short-term performance. Nonetheless, rising short-term and long-term interest rates should limit further P/E multiple expansion. At 2.8%, the US 10-year Treasury yield has risen by 40 bp in the last two months and now stands at the highest level since 2014. We expect it will reach 3.0% by year- end as the term premium rises and the market moves toward our economists’ forecast of four Fed rates hikes in each of 2018 and 2019.
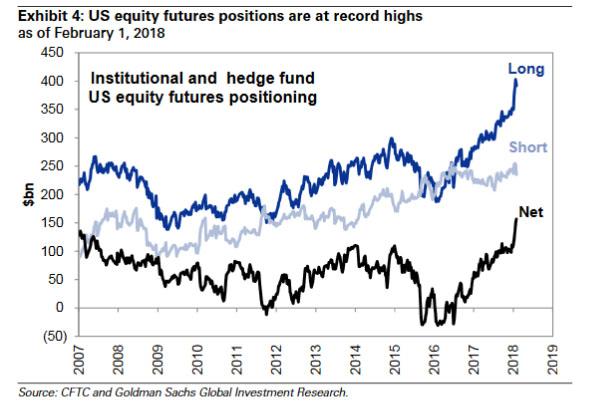
But the biggest risk to a coordinated liquidation is neither fundamentals, nor vivid recollections of Black Monday (by those traders who were at least alive when it happened), but investor positioning. As of this moment, institutions and hedge funds have never - ever - been more bullish:
CFTC equity futures positioning data show that investors increased long US equity positions by $40 billion this year, bringing long and net positions to new record highs(see Exhibit 4). Similarly, NYSE net margin debt is at its highest level relative to market cap since at least 1980.
And after a week like the last, if what was until recently going only up no longer goes up, there is just one alternative: down, express elevator style. It will be amusing to watch as the record net long exposure turns not so net long, especially with traders having forgotten how to sell thanks to sentiment at the highest on record.

Which brings us to Goldman's tacit hint what happens next: "Investors who are already long cash equities could instead consider purchasing puts as protection", which 'curiously' is precisely what Morgan Stanley said two weeks ago.
PD2: Los bonos son los que mandan, te lo recuerdo para que no te olvides. Estos son los rendimientos acumulados que han proporcionado unos y otros desde 2000. Pero si te fijas en los últimos dos años, algo no iba bien, no estaban funcionando al alimón:

Desde 2012 se ve con mucha más claridad…
Los bonos mandan y marcan la tendencia. Siempre ha sido así y siempre lo será. Por mucha euforia que haya en la bolsa, la tendencia la marcan los bonos…
Ahora el ajuste se tiene que dar…
PD3: La otra cuestión que se respira es si esto es una simple corrección a la media, como llevo diciendo muchas semanas, o es un momento de pánico generado por los excesos parabólicos recientes. ¿Hasta dónde corregirá? Son los 2250/2500 puntos del SP500 que yo creo es donde se parará, o se perderá todo lo ganado en esta parábola y se irá a los 2100 ¿? Quién sabe…

PD4: Habrá rebote de “gato muerto”, siempre se produce cuando hay caídas muy verticales…Pasa del gato muerto, que no te engañe, si quieres entrar, espera. Muchos dicen que con que hubiera una “reversión a la media” sería suficiente, que con que el SP500 llegara a los 2500 puntos sería el suelo:

Yo lo dudo…, creo que se debe apoyar en su tendencia, en los 2250 puntos como poco, y esto suponiendo que no haya + canguele por medio… Pero ya sabes, lo habitual de un pesimista empedernido como yo…
Lo que está claro es lo de la escalera y el tobogán:

SP500:

Tanta euforia previa nos trae lo que nos trae…
Y los grandes perjudicados son los ETFs… Ha habido un cisco en los ETFs de volatilidad (VIX). Tanto apalancamiento puede llevarse a muchos por el camino, como ha ocurrido, con perjuicios para varias entidades financieras…
PD5: El egoísmo es la fuente más infalible de infelicidad para uno mismo y para los que le rodean. Un egoísta machaca a su familia… Y la envidia corroe al que no ve con buenos ojos lo que tiene, lo que le rodea, le matan los ojos. Hay que cuidar ambos defectos que, por cierto, son pecados…