Esto se publicó el pasado 4 de enero. Yo decía cosas muy parecidas por entonces… Un fenómeno el tipo. Léetelo, ya que ciertas consecuencias no son bonitas:
Bracing Yourself for a Possible Near-Term Melt-Up
(A Very Personal View)1
I find myself in an interesting position for an investor from the value school. I recognize on one hand that this is one of the highest-priced markets in US history. On the other hand, as a historian of the great equity bubbles, I also recognize that we are currently showing signs of entering the blow-off or melt-up phase of this very long bull market. The data on the high price of the market is clean and factual. We can be as certain as we ever get in stock market analysis that the current price is exceptionally high. In contrast, my judgment on the melt-up is based on a mish-mash of statistical and psychological factors based on previous eras, each one very different, so that much of the information available is not easily comparable. It also leans very heavily on a few US examples. Yet, strangely, I find the less statistical data more compelling in this bubble context than the simple fact of overpricing. Whether you will also, dear reader, remains to be seen. In any case, my task in this note is to present the evidence, both statistical and touchy-feely, as clearly as I can.
So let's start by looking very hard at all the great bubbles of the past, searching for useful guides to the future. The classic examples are not just characterized by higher-than-average prices. Price alone seems to me now to be by no means a sufficient sign of an impending bubble break. Among other factors, indicators of extremes of euphoria seem much more important than price. Ben Graham, as quoted two quarterly letters ago, said that as far as he could see no bubble had ever broken (by 1963) without being accompanied by signs of real excess such as those found in 1929. Two months ago, Robert Shiller also made the point (in the Sunday New York Times) – as I will do – that not nearly enough signs of euphoria were yet present to make this look like a late-stage bubble. (Although in my opinion they have finally begun to pick up in the last two or three months.) And Robert Shiller was one of a very small group predicting a future market collapse in 1999, and one of a few handfuls with us in 2006 focusing on the future risks from an unprecedented US housing bubble breaking due to vulnerable mortgages. So when he held his fire this time on the issues of a market crash, as I have done, waiting for more evidence, I took considerable comfort. After all, for a major investment bubble to burst it must first form, and this one has been very slow to do that, at least until recently.
While I am attacking the concept of leaning on price alone I should add that I carry a lot of blame for exaggerating the significance of price alone as a bubble measure. After all, I helped pioneer the data-mined result that previous bubbles have been separated from ordinary bull markets by passing through 2 standard deviations on their price series, a level that statistically should occur every 44 years in a random series. It has been a very useful assumption for a broad-based study of global bubbles in a variety of asset classes and it had, of course, a good historical record, because that's how we picked it. But this time, this statistical measure has been misleading because as the US market hit a 2-sigma level, it had almost none of the other more important bubble indicators of investor euphoria and even craziness. Similarly, early 1998 had none when we reduced our risk levels to a minimum based on price alone. In complete contrast, late 1999 and early 2000 had very many signs of bubbly, completely irrational behavior, just as mid, or even early 1929 had.
Is a late bubble surge beginning?
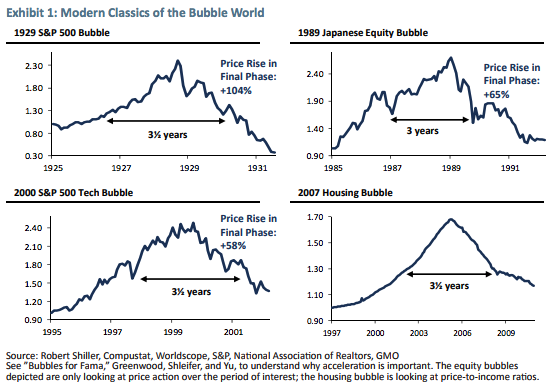
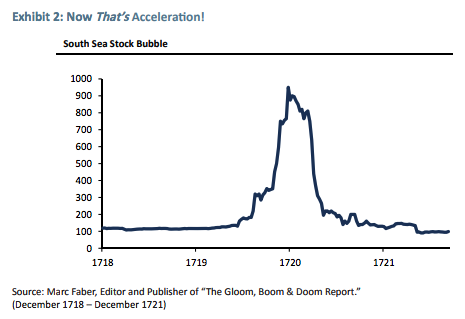
So let's look at what is missing in the way of psychological and technical signs of a late-stage bubble and what is beginning to fall into place. On the topic of classic bubbles, I have long shown Exhibits 1 and 2. They recognize the importance of a true psychological event of momentum increasing to a frenzy. That is to say, acceleration of price. The average time of the final bubble phase of the great equity bubbles shown in Exhibit 1 is just under 3.5 years, with the average upcycle of real acceleration just 21 months. And the two smaller equity bubbles had gains of 65% and 58%. They also show an interesting symmetry, don't you think? Rising and falling at about the same rate, as did the real McCoy – the South Sea Bubble shown in Exhibit 2 – before them. Yes, there is a real danger of being late. And in general, average market declines are considerably faster than average advances. But historically, when dealing with real bubbles, being late has not been materially different in time and pain than being too early, as you can see. Value managers are historically painfully too early over and over again, as I know better than most.
So let's look at what is missing in the way of psychological and technical signs of a late-stage bubble and what is beginning to fall into place. On the topic of classic bubbles, I have long shown Exhibits 1 and 2. They recognize the importance of a true psychological event of momentum increasing to a frenzy. That is to say, acceleration of price. The average time of the final bubble phase of the great equity bubbles shown in Exhibit 1 is just under 3.5 years, with the average upcycle of real acceleration just 21 months. And the two smaller equity bubbles had gains of 65% and 58%. They also show an interesting symmetry, don't you think? Rising and falling at about the same rate, as did the real McCoy – the South Sea Bubble shown in Exhibit 2 – before them. Yes, there is a real danger of being late. And in general, average market declines are considerably faster than average advances. But historically, when dealing with real bubbles, being late has not been materially different in time and pain than being too early, as you can see. Value managers are historically painfully too early over and over again, as I know better than most.


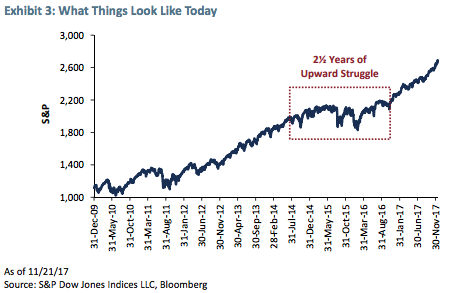
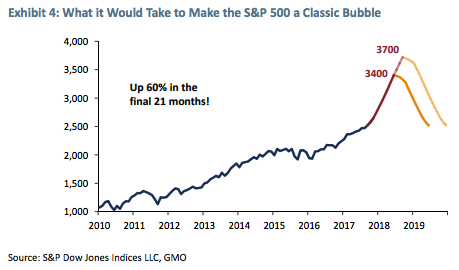
Recently an academic paper titled "Bubbles for Fama"2 concluded that in the US and almost all global markets, the strongest indicator – stronger than pure pricing or value – was indeed price acceleration. (This is perhaps the third time I have agreed with mainstream economists in the last 50 years. I have a firm principle of generously quoting them when they agree with me.) Exhibit 3 shows what the market looks like today. Until very recently it could justifiably be described as clawing its way steadily higher. But just recently, say the last six months, we have been showing a modest acceleration, the base camp, perhaps, for a final possible assault on the peak. Exhibit 4 represents our quick effort at showing what level of acceleration it might take to make 2018 (and possibly 2019) look like a classic bubble. A range of 9 to 18 months from today and a price rise to around 3,400 to 3,700 on the S&P 500 would show the same 60% gain over 21 months as the least of the other classic bubble events.


What of other indicators? I have previously defined a great bubble as being "Excellent Fundamentals Euphorically Extrapolated." And I have previously concluded that, in general, the fundamentals of recent years were disappointing and that investors, far from being euphoric, had instead been "climbing the wall of worry" as they used to say. But fundamentals are improving. The global economy is in sync for the first time in a dozen years and global profit margins are at a high; in the US, a corporate tax cut is on the way, which in today's sticky, more monopolistic world, is unlikely to be quickly competed away as theory suggests, but very likely to further fatten the corporate share of the GDP pie and perhaps provide the oomph to keep stock prices rising.
In looking for signs of late bubble behavior, we have to reconcile to the fact that no two bubbles, even the classics, are the same. They share the fact that there are many signs of investor euphoria, sometimes indeed approaching the madness of crowds, but the package of psychological and technical indicators has been different each time. The historian has to emphasize the big picture: In general are investors getting clearly carried away? Are prices accelerating? Is the market narrowing? And, are at least some of the other early warnings from the previous great bubbles falling into place?
Increasing concentration and unusual outperformance of quality and low beta
These are really two separate points and they can occur separately, but sometimes the data overlaps so it's convenient to examine them together. Between them I believe they are right behind acceleration in their effectiveness in warning of a late-stage bubble. First, the principles: Concentration is the essence of an escalating euphoria. By late-stage cycles, many buyers are fixating on "winners" with the purchase motive being further stock gains, rather than any logic of long-term value. Thus, as the market soars, attention is increasingly focused on those with the largest earnings and stock price gains, and interest in the B players falls away. (This concentration effect naturally favors larger companies, perhaps because they can better absorb a rising demand.)
These are really two separate points and they can occur separately, but sometimes the data overlaps so it's convenient to examine them together. Between them I believe they are right behind acceleration in their effectiveness in warning of a late-stage bubble. First, the principles: Concentration is the essence of an escalating euphoria. By late-stage cycles, many buyers are fixating on "winners" with the purchase motive being further stock gains, rather than any logic of long-term value. Thus, as the market soars, attention is increasingly focused on those with the largest earnings and stock price gains, and interest in the B players falls away. (This concentration effect naturally favors larger companies, perhaps because they can better absorb a rising demand.)
The second principle is the outperformance of quality and low beta stocks in a rapidly-rising market. This is clearly odd behavior and is very rare, restricted as far as I can tell to some, but not all, late-stage bull markets. I attribute the logic for this – and this effect is something I noticed almost 40 years ago when studying the Crash of 1929 – to Chuck Prince; a series of Chuck Princes over the years might have said, "The market keeps going up faster and faster and there is no way commercially that I can play against it. So I have to keep dancing. But at least I don't have to risk dancing off the cliff with a Pumatech." (My favorite example of an extreme speculation – the most advanced stock in 1999, a very high hurdle.) "Rather, I will keep dancing with RCA or GE in 1929, Coca Cola and Avon in 1972, and Cisco and Microsoft in 1999." It makes at least some sense (and in 1929 caused you to lose a mere 80% rather than 95% – a quadrupling difference in recovery). Now, to take the markets in sequence…
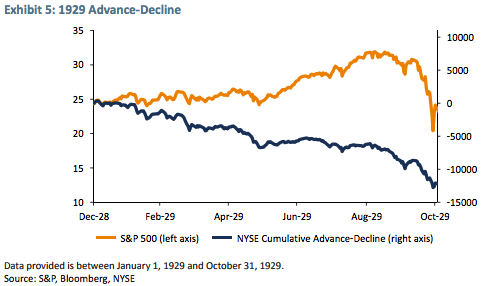
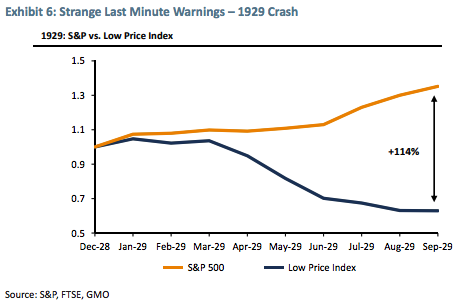
The 1929 Crash. A reasonable indicator of increasing concentration is the advance-decline line,3 and Exhibit 5 makes it clear what was happening. But my favorite all-time data is shown in Exhibit 6. This looks at the S&P's "Low Price Index," comprising very fallen industrial angels. This indicator, sadly abandoned in the late 90s, had a very high and very variable beta (about 1.4) and the index had just had a magnificent 1928, more than doubling the S&P 500 (+72% to +33). Then, in 1929, it produces what I call the great primal scream of all-time from the market: By the time the S&P 500 peaks in October, up 35% for the year, accompanied by all the touchy-feely signs of crazy speculation, the Low Price Index is down 37%, having fallen steadily all year!


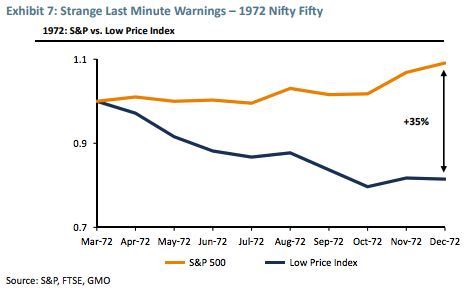
1972 – The Nifty Fifty. All measures of concentration increased in 1972, and in that "Nifty Fifty" era from the early 60s – in which 50 IBMs, Coca-Colas, and Avons were increasingly favored, culminating in the only large premium ever for quality stocks (50%) – the advance-decline ratio, not surprisingly, trended steadily downward, as it continued to do in 1972 in a non-remarkable way. So, no exhibit. More interesting, I think, is the outperformance over our friend, the high-beta Low Price Index, by the S&P 500 (see Exhibit 7). And most compelling for me is that this was the very first time since 1929 that high-beta stocks were soundly beaten as the S&P 500 rose significantly. And the 1972 high ushered in by far the biggest stock market decline since The Great Depression. The 1973-74 decline in the S&P was 63% in real terms, still the second worst decline to date in the post 1925 era. You have to admit this odd signal did a great job in these first two bubbles of the twentieth century.

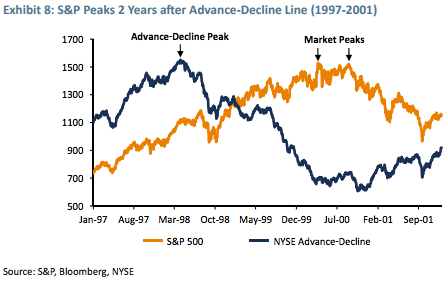
The Tech Bubble of 2000. In contrast to the previous two, this bubble was preceded by a very clear signal indeed from the advance-decline line, as shown in Exhibit 8, which, after rising strongly, turned down equally emphatically 2 full years before the market's first peak in March 2000.

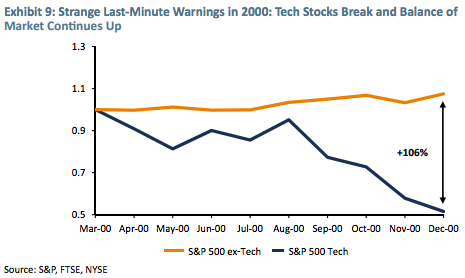
A second very clear but unusual signal was given between the two peaks of the S&P 500 in March and September 2000. (They were both within 1% of each other.) In this short period, the tech stocks broke and declined rapidly, but in a possibly unique pattern, the rest of the S&P continued up to a substantial new high as shown in Exhibit 9. From March through December 2000, the deviation was so great that technology stocks would have had to rally 106% to close the gap. What a great escape opportunity, offered before the balance of the S&P rolled over and declined about 40%.

The possible/probable bubble of 2018-19
The advance-decline line is clearly not delivering a threatening message yet. It has risen, apparently inexorably, along with the S&P 500, perhaps helped along by the rising percentage of index purchases (a separate, interesting topic). So, for the time being, no bubble-bursting early warning there. The high-betaloses paradox, on the other hand, appears to be giving a very early warning as quality stocks extend an unusual upside lead. Exhibit 10 shows the year-to-date gains of our Quality universe against the S&P 500 (+9%), just as our junk universe, with its higher beta, shows an equal and offsetting underperformance (-7%). This is by no means up there with some earlier "last minute" warnings, but it is interesting. (And even if you remove the FAANGs from the universe, this interesting result still holds.)
The advance-decline line is clearly not delivering a threatening message yet. It has risen, apparently inexorably, along with the S&P 500, perhaps helped along by the rising percentage of index purchases (a separate, interesting topic). So, for the time being, no bubble-bursting early warning there. The high-betaloses paradox, on the other hand, appears to be giving a very early warning as quality stocks extend an unusual upside lead. Exhibit 10 shows the year-to-date gains of our Quality universe against the S&P 500 (+9%), just as our junk universe, with its higher beta, shows an equal and offsetting underperformance (-7%). This is by no means up there with some earlier "last minute" warnings, but it is interesting. (And even if you remove the FAANGs from the universe, this interesting result still holds.)

Other asset classes making impressive bubbly moves
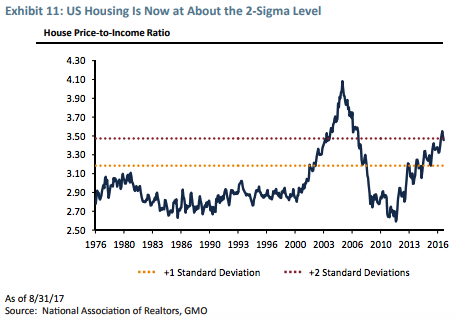
The US housing market lacks the touchy-feely signs of euphoria that described it in 2004, 2005, and 2006 – the classic sign being the level of cocktail party bragging about condos in Florida that had just gone up 100% in price in a hurry. (The exception to this observation might be in a few hot cities, this time San Francisco, Boston, and New York.) But the basic data in Exhibit 11 shows that the average US house price, as a multiple of family income, is way higher than at any time before the great 3-sigma housing bubble of 2006. Those extraordinary and nationwide prices then perhaps serve to camouflage the current 2-sigma rise, as the outrageous prices of 2006 make today's high prices seem less unreasonable. The existence of today's 2-sigma house market may serve once again to point out that price alone is not as reliable a guide as we would like.
The US housing market lacks the touchy-feely signs of euphoria that described it in 2004, 2005, and 2006 – the classic sign being the level of cocktail party bragging about condos in Florida that had just gone up 100% in price in a hurry. (The exception to this observation might be in a few hot cities, this time San Francisco, Boston, and New York.) But the basic data in Exhibit 11 shows that the average US house price, as a multiple of family income, is way higher than at any time before the great 3-sigma housing bubble of 2006. Those extraordinary and nationwide prices then perhaps serve to camouflage the current 2-sigma rise, as the outrageous prices of 2006 make today's high prices seem less unreasonable. The existence of today's 2-sigma house market may serve once again to point out that price alone is not as reliable a guide as we would like.

Perhaps housing supply and zoning considerations introduce elements happily lacking in the equities markets. They also suggest that in the next down leg, some global housing markets (mainly Englishspeaking) are important legs of the stool that can break badly, although, in this respect, the US, for once, looks like a financial powerhouse with its higher deposits and fixed-rate mortgages. In a circular but probably accurate argument, just as rising house prices facilitate the development of an optimistic attitude for other assets, a US equity market melt-up, were it indeed to occur, would create exactly the right investment mood for another advance in house prices, with predictable consequences for the severity of the ensuing, more or less inevitable, crash.
Right party in power (just sayin')
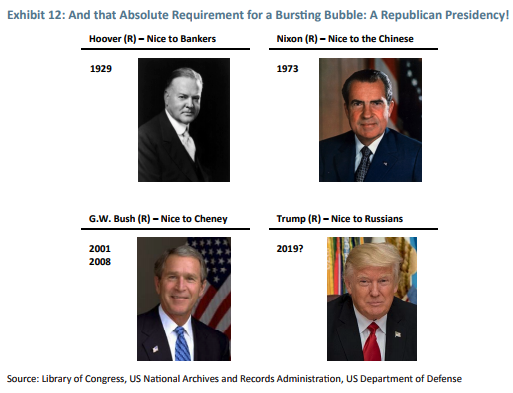
This point is an excuse for using Exhibit 12, which was prepared for our recent annual client conference. The data speaks for itself. Its statistical significance is another matter entirely.
This point is an excuse for using Exhibit 12, which was prepared for our recent annual client conference. The data speaks for itself. Its statistical significance is another matter entirely.

Extreme expensiveness
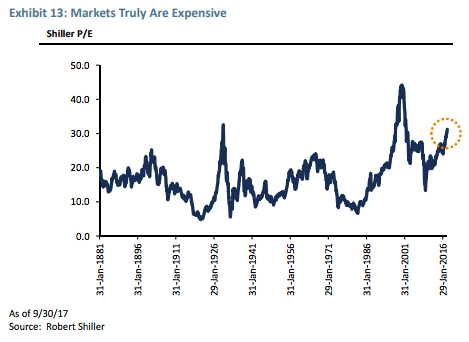
At last, we come to value. Extreme overvaluation plays a huge role in bubbles breaking: It is a necessary precondition. The more overvalued, the merrier. But, for judging the extent that bubbles will overrun fair value and for timing the break, value, sadly, is largely irrelevant. Thus, it is a necessary but absolutely not sufficient condition. Exhibit 13 shows how handsomely the current cycle already passes the necessary condition.
At last, we come to value. Extreme overvaluation plays a huge role in bubbles breaking: It is a necessary precondition. The more overvalued, the merrier. But, for judging the extent that bubbles will overrun fair value and for timing the break, value, sadly, is largely irrelevant. Thus, it is a necessary but absolutely not sufficient condition. Exhibit 13 shows how handsomely the current cycle already passes the necessary condition.

The Fed's role in recent bubbles
Taking a different tack, we should look at the policy of what I call the Greenspan-Bernanke-Yellen Fed. This policy of pushing down generally on rates – lower highs and lower lows – over 25 years, accompanied by a lot of moral hazard, has very probably helped push asset prices higher. All three Chairmen at some time have specifically taken credit for helping the economy by generating a wealth effect from a higher market. Over the years we have come to believe that moral hazard is more important in raising asset price levels than the interest rate level and availability of credit, although they may also help. The moral hazard – the asymmetric promise to help if times get tough but to leave you alone when times are rolling – had become increasingly well-understood, particularly during Greenspan's first 15 years. It seems likely that such a policy as the Greenspan Put might culminate periodically in investment bubbles of the type it did indeed generate in the 2000 TMT bubble and the 2006 housing bubble. And the likelihood of bubbles forming no doubt increased because all three Fed bosses outspokenly denied that such bubbles were occurring even as they passed through 2-sigma levels. Greenspan poetically argued in 1999 that the internet was driving away the dark clouds of ignorance and was issuing in a new era of permanently higher productivity. Think how encouraging this was to the bulls as the market in 1998 went past the 21x peak of 1929 and climbed remorselessly (and at an accelerating rate!) to 35x. Even more statistically remarkable was Bernanke's dismissal of a clear 3-sigma US housing market – a one in a thousand event normally – as "merely a reflection of a strong US economy," and that "US house prices had never declined!" That was accurate enough, but what it really meant – and was interpreted as meaning – was that US housing prices would not decline in the future. But, of course, the US housing market had never been tested by a 3-sigma bubble before! And the rest is history.
Taking a different tack, we should look at the policy of what I call the Greenspan-Bernanke-Yellen Fed. This policy of pushing down generally on rates – lower highs and lower lows – over 25 years, accompanied by a lot of moral hazard, has very probably helped push asset prices higher. All three Chairmen at some time have specifically taken credit for helping the economy by generating a wealth effect from a higher market. Over the years we have come to believe that moral hazard is more important in raising asset price levels than the interest rate level and availability of credit, although they may also help. The moral hazard – the asymmetric promise to help if times get tough but to leave you alone when times are rolling – had become increasingly well-understood, particularly during Greenspan's first 15 years. It seems likely that such a policy as the Greenspan Put might culminate periodically in investment bubbles of the type it did indeed generate in the 2000 TMT bubble and the 2006 housing bubble. And the likelihood of bubbles forming no doubt increased because all three Fed bosses outspokenly denied that such bubbles were occurring even as they passed through 2-sigma levels. Greenspan poetically argued in 1999 that the internet was driving away the dark clouds of ignorance and was issuing in a new era of permanently higher productivity. Think how encouraging this was to the bulls as the market in 1998 went past the 21x peak of 1929 and climbed remorselessly (and at an accelerating rate!) to 35x. Even more statistically remarkable was Bernanke's dismissal of a clear 3-sigma US housing market – a one in a thousand event normally – as "merely a reflection of a strong US economy," and that "US house prices had never declined!" That was accurate enough, but what it really meant – and was interpreted as meaning – was that US housing prices would not decline in the future. But, of course, the US housing market had never been tested by a 3-sigma bubble before! And the rest is history.
The point here is that Yellen, too, sees no signs of dangerous stock prices and in general continues with the program of moral hazard. Yes, rates will rise, just as they rose from 2003 to 2006, but it is considered, quite rightly, to be cyclically normal in a tightening economy and so does not constitute a breach of contract. (The recent rate rises, just like the 400-basis-point rise from 2003 to 2006, did not at all get in the way of rising stock prices any more consequently than the two recent rises of this cycle have.) So why would the Fed stop its general asymmetric support before we reach a third bubble? Nothing is certain in life, but I would bet that a Yellen-like successor of the lower-rates-arehelpful variety will get the job done (Mr. Powell should fit the bill) and deliver a third in their series of Great Bubbles. A major shift in style of the Fed, on the other hand, based on an accumulation of new appointees who would turn away from the accommodating style of the last 30 years, would reduce the chances of a well-behaved classic bubble forming in the next year or two. But if we have a strong head of steam up by next February, it might well happen anyway. We'll deal with that when we get there. The bottom-line question is probably this: Will this administration, when faced with either a market break or unexpected economic weakness, not push the completely independent Fed committee for lenient, lower-rate policies? Surely it will. (The Presidential Cycle of a very strong pre-election effect and a compensating weak "recycling" in post-election years one and two that existed in earlier Fed regimes did not come out of thin air, but presumably from deliberate influence. Since Greenspan was appointed, though, we seem to have lived, at least most of the time, stuck in a year-three phase of stimulus.)

The most difficult call: Are the more touchy-feely measures of market excess falling into place?
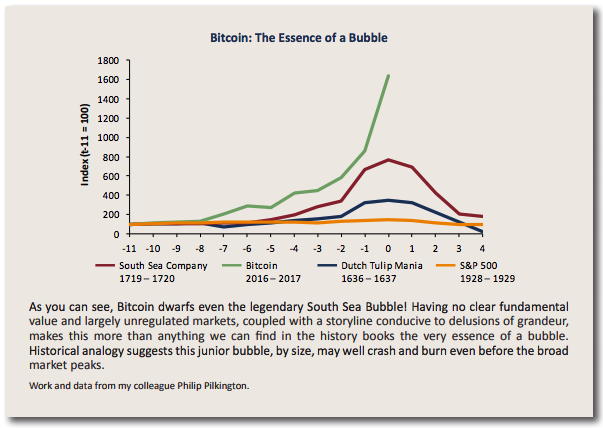
Anyone around in 1999 and early 2000 has had a classic primer in these signs. We know we're not there yet, but we can perhaps see some early movement: increasing vindictiveness to the bears for costing investors money; the crazy Bitcoins of the world (this is a true, crazy mini-bubble of its own I expect – it has certainly passed my "nephew test" of his obsessing about buying or not); and Amazon and the other handful of current heroes – here and globally – taking over more of the press coverage and a growing percentage of total market gains (Amazon +13%, the day before I started to write this, and Tencent doubling this year to a $500 billion market cap). The increasingly optimistic tone of press and TV coverage is also important. A mere six months ago, new market highs were hardly mentioned and learned bears were featured everywhere. Now, the newspaper and TV coverage is considerably more interested in market events. (This last comment reminds me of some advice for contrarians: There is usually a phase or two in each cycle where most investors expect a market gain or loss and it actually happens. The mass of investors usually ends up wrong in the end, but not all the time, for Heaven's sake!)
Anyone around in 1999 and early 2000 has had a classic primer in these signs. We know we're not there yet, but we can perhaps see some early movement: increasing vindictiveness to the bears for costing investors money; the crazy Bitcoins of the world (this is a true, crazy mini-bubble of its own I expect – it has certainly passed my "nephew test" of his obsessing about buying or not); and Amazon and the other handful of current heroes – here and globally – taking over more of the press coverage and a growing percentage of total market gains (Amazon +13%, the day before I started to write this, and Tencent doubling this year to a $500 billion market cap). The increasingly optimistic tone of press and TV coverage is also important. A mere six months ago, new market highs were hardly mentioned and learned bears were featured everywhere. Now, the newspaper and TV coverage is considerably more interested in market events. (This last comment reminds me of some advice for contrarians: There is usually a phase or two in each cycle where most investors expect a market gain or loss and it actually happens. The mass of investors usually ends up wrong in the end, but not all the time, for Heaven's sake!)
Other items worth mentioning are IPO windows and new record highs for corporate deals. We can have a satisfactory melt-up without them, but still one or the other is likely and both together are quite possible. I believe their presence would make a spectacular bust that much more likely.
Finally, my favorite advice once again: Keep an eye on what the TVs at lunchtime eateries are showing. When most have talking heads yammering about Amazon, Tencent, and Bitcoin and not Patriot replays – just as late 1999 featured the latest in Pets.com – we are probably down to the last few months. Good luck. We'll all need some.
Summary of my guesses (absolutely my personal views)
■ A melt-up or end-phase of a bubble within the next 6 months to 2 years is likely, i.e., over 50%.
■ If there is a melt-up, then the odds of a subsequent bubble break or melt-down are very, very high, i.e., over 90%.
■ If there is a market decline following a melt-up, it is quite likely to be a decline of some 50% (see Appendix).
■ If such a decline takes place, I believe the market is very likely (over 2:1) to bounce back up way over the pre 1998 level of 15x, but likely a bit below the average trend of the last 20 years, as the trend slowly works its way back toward the old normal on my "Not with a Bang but a Whimper" flight path.4
A. Suggested action plan for everyone
■ What I would own is as much Emerging Market Equity as your career or business risk can tolerate, and some EAFE. I believe each of these, especially Emerging, has more potential than most think (as noted in my recent piece in GMO's 3Q 2017 Letter).
B. For those individual investors willing to speculate5
■ Consider a small hedge of some high-momentum stocks primarily in the US and possibly including a few of the obvious candidates in China. In previous great bubbles we have ended with sensational gains, both in speed and extent, from a decreasing number of favorites. This is the best possible hedge against the underperformance you will suffer if invested in a sensible relative-value portfolio in the event of a melt-up.
■ As is also true in Case A, if we have the accelerating rally that has typified previous blow-off phases, you should be ready to reduce equity exposure, ideally by a lot if you can stand it, when either the psychological signs become extreme, or when, after further considerable gain, the market convincingly stumbles. If you can't cope with this thought and can't develop and execute an exit strategy, then sit tight and ignore all this advice, except for an overweighting of Emerging. I certainly recognize that leaping out of declining markets is a completely unrealistic idea for large, illiquid institutions and nerve-wracking enough for even the toughest-minded individuals. In this sense you can treat this paper as an academic exercise… the musings of an old student of the market, who thinks he sees the signs of an impending melt-up that will be painful for value investors. Is it better to be warned and suffer than be surprised and suffer? At least when warned you can brace yourselves.
Postscript: Possible Political Consequences
Living in a hyper-political era, I should mention that if my best guesses are correct, a near-term meltup would obviously help the current administration at mid-term, just as the subsequent and highly probable melt-down would seriously hurt it.
Living in a hyper-political era, I should mention that if my best guesses are correct, a near-term meltup would obviously help the current administration at mid-term, just as the subsequent and highly probable melt-down would seriously hurt it.
Appendix: Structural Flaws
Market bears list an impressive number of structural stress points under the surface of the economy and the financial system. Perhaps they are correct, as were some early warners in 1929 about deteriorating fundamentals. Certainly some of their points will turn out to be at least partially correct. But for a bubble to form from here we only need the ship to hold together and look good for another few quarters. And to be fair, economies are often, even typically, considerably more resilient and capable of muddling through than bearish arguments would suggest. Both here and elsewhere. (China, for example, with its empty trains and empty cities and booming house prices has been predictively doomed for years even as its trains and cities fill up and its remarkable gains in average wages in the last three years far exceed the house price rises in 80% of its cities.) Having said all this, if the bubble ends in the way I expect it will, then the structural stress may well help the decline become, in technical terms, a real humdinger.
Market bears list an impressive number of structural stress points under the surface of the economy and the financial system. Perhaps they are correct, as were some early warners in 1929 about deteriorating fundamentals. Certainly some of their points will turn out to be at least partially correct. But for a bubble to form from here we only need the ship to hold together and look good for another few quarters. And to be fair, economies are often, even typically, considerably more resilient and capable of muddling through than bearish arguments would suggest. Both here and elsewhere. (China, for example, with its empty trains and empty cities and booming house prices has been predictively doomed for years even as its trains and cities fill up and its remarkable gains in average wages in the last three years far exceed the house price rises in 80% of its cities.) Having said all this, if the bubble ends in the way I expect it will, then the structural stress may well help the decline become, in technical terms, a real humdinger.
1 My job at GMO is an enviable one: to comment on any broad issue that might affect the market. My views are not always closely aligned with those of our various investment teams at GMO, including Asset Allocation, the group to which I belong.
2 Robin Greenwood, Andrei Shleifer, and Yang Yu, Harvard University, Revised, February 2017.
3 The number of advancing stocks less the number of declining stocks
4 GMO Quarterly Letter, 3Q 2016.
5 That is to say, willing to invest in an asset with an unusually low long-term return, an expectation of a shorter-term price game.
Abrazos,
PD1: Ayer volvieron a subir los bonos estadounidenses (se aproxima al 3% el bono a 10 años), tras saber que la FED podría llegar a subir hasta 4 veces los tipos de interés este año:

El ajuste está siendo muy rápido:

Y esto acojona al mercado de acciones:
Además, las rentabilidades que se van alcanzando en los bonos empiezan a ser sustitutivas a las acciones con demasiadas altas valoraciones:

Esta es la probabilidad de que haya 4 subidas de tipos de interés en EEUU este año (la primera será en marzo):

Es el miedo a la inflación, a que repunte, ya que la FED no tendrá más remedio que subir los tipos todo lo que pueda para tratar de frenarla, como siempre ha hecho, al margen del palo que está recibiendo en los bonos que tiene en cartera:

PD2: No hay que perder la paz con nuestros defectos, ni hacer las paces con ellos… Solo tratar de corregirlos. Compensa, sobre todo al que tienes al lado.