Buena pregunta que, sobre todo hay que hacerse en las bolsas que más han subido, la de EEUU (Dow Jones, SP500, Nasdaq, toda esa burrada de subida de los FAANGs…), Alemania y otros mercados desarrollados….
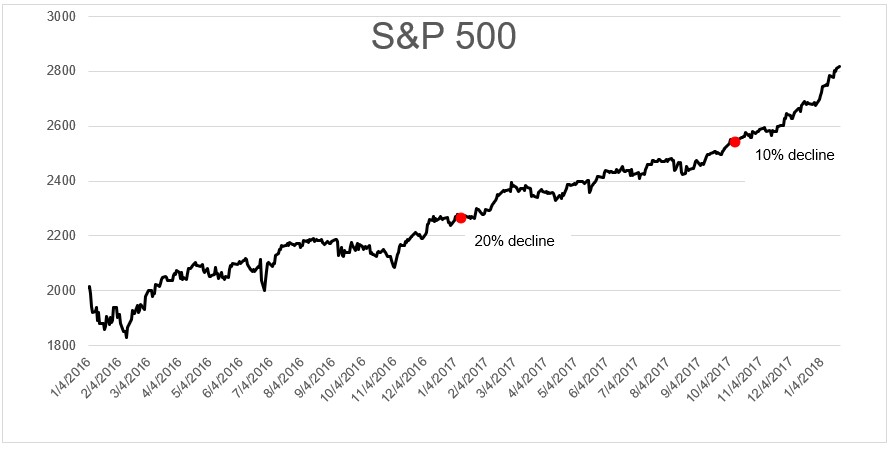
Soy de la teoría que se van a dejar un buen 20% desde los altos hechos estos días de 2870 puntos del SP500. Es decir, no compres nada hasta los 2280 puntos. Lo demás será un engañabobos, que siempre los hay, rebotes de gato muerto y similares… Aún no ha empezado apenas la consolidación de niveles.
A Few Charts and a Few Thoughts
Amazon gained 56% in 2017. Google gained 33%. Apparently that wasn’t enough. Year-to-date they’ve tacked on another 12.5% and 10.6% respectively, adding a combined $147,782,647,497 in market capitalization.
Amazon’s market cap was $70 billion in 2011. It just added the equivalent amount in fourteen days. That’s bigger than Colgate-Palmolive and General Motors and Marriott and 83% of companies in the S&P 500. Things are starting to get silly, and it’s not just happening at the company level, it’s showing up in the indexes.
After posting a 22% gain in 2017, the S&P 500 is picking up right where it left off. It’s up 5.6% year-to-date. At this point, a 10% correction, which would not only be healthy, but doctor’s orders, would take the index back to where it was in October. A bear market would take the index back to where it was in January 2017, the point at which some people had bailed out of fears that the President would be catastrophic for the stock market.

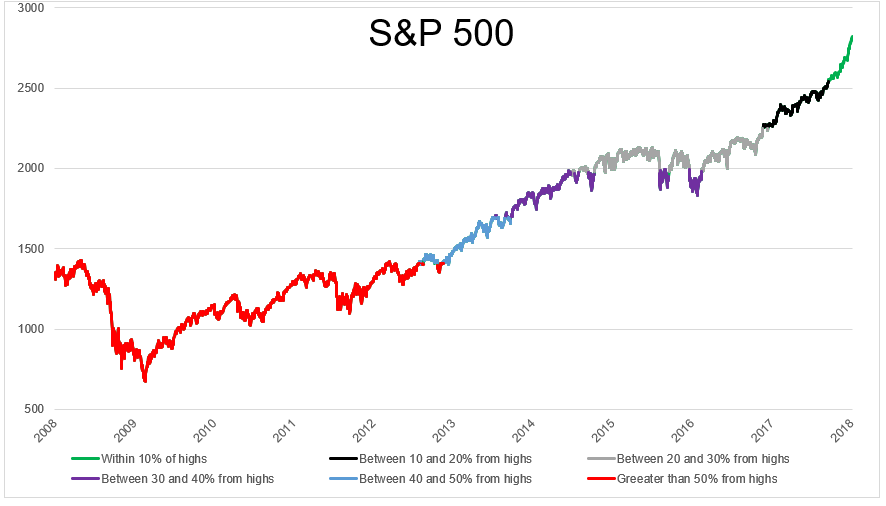
We’re just about two years removed from the bear market that wasn’t officially a bear market. Since the February 2016 lows, the S&P 500 is up an incredible 56%. A 36% decline from here would certainly scare the heck out of a lot of investors, but that would only take us back to where we were two years ago. A 50% crash would take the index back to the beginning of 2013- which is when a lot of the current bears started to growl.

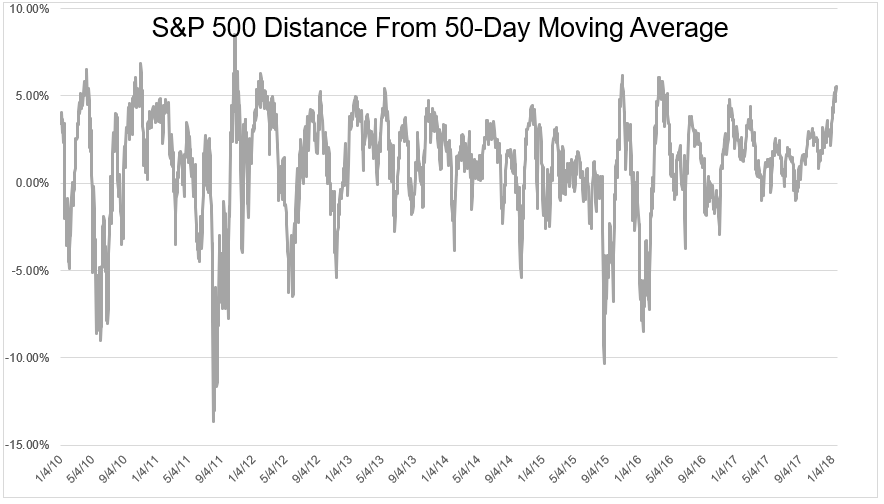
The S&P 500 is now 5.5% above its 50-day moving average. Since 1950, the S&P 500 has experienced this 6% of the time. Certainly not unheard of, but not a usual occurrence either. The S&P 500 was up 32% in 2013 and 38% in 1995, and neither of those years saw this type of relentless buying.

Reading this, you might get the feeling that I expect the market to do something or that I’m positioned a certain way. I am not. I’m neither bullish nor bearish, I learned to stop playing that game a while ago. The biggest takeaway for the average investor who is trying to figure out what is going and and what they should do with their money is this: nobody knows what’s going on. Nobody knows where the market is going and nobody will be able to explain why it did what it did even after the fact.
If you think things are getting silly now or have been that way for a while, there is no law to prevent them from getting a whole lot sillier.
Pero cuidado ya que no todo va a corregir por igual. Va a haber grandes diferencias… Abrazos,
PD1: La mayor señal de venta se dio la semana pasada, con unos mercados en máximos y entrando dinero a saco, es señal inequívoca de que va a corregir, cuando está hasta el tato invertido (el tato es el taxista).
Biggest Stock Sell Signal Since 2013 Sparked By Record Inflows
Investors added the most money on record to equity funds last week as the earnings season began on a positive note and global stocks continued to post record highs. That’s contributing to the strongest sell signal since 2013, by one gauge.
They poured $33.2 billion into stocks in the week to Jan. 24, Bank of America Merrill Lynch said in a research report, citing EPFR Global data. Actively managed equity portfolios, technology funds and Treasury Inflation Protected Securities all enjoyed record inflows.

U.S. stocks saw $7 billion of inflows while the $4.6 billion invested in European shares was the biggest in 37 weeks, the bank said. Emerging market equities received $8.1 billion in fresh money, the second biggest amount in the data series.
Investors have enjoyed a stellar start to 2018 as bets on broadening global economic growth and profit expansion pushed stocks to all-time highs this month. The MSCI ACWI Index, a gauge of both developed and emerging market equities, has risen 6.3 percent since the beginning of the year.
The rush to risk assets sparked a note of caution from Bank of America’s strategists, who now see a “tactical pullback” in the stock market as likely in the first quarter, at least for the S&P 500. The bank’s “Bull & Bear” indicator has given the highest “sell” signal since March 2013, according to the report.
PD2: Envidia es lo que genera andar comparándonos con los otros. No te compares, cada uno es como es y sus circunstancias. Puede que la pasta la hayan heredado. Puede que sean mucho más listos que nosotros…, puede que sea cualquier cosa, pero aquí está la famosa lista de las 350 personas más ricas de España: http://lab.elmundo.es/los-mas-ricos/ Por cierto, no conozco a ninguno. Una pena, ya que con que se me hiciera uno cliente me bastaría para salir de esta pobreza mía…
Y ya sabes que el dinero no da la felicidad y eso. No da más que quebraderos de cabeza, y el afán por tener más si cabe… Esta realidad de que nosotros, todos los que hemos leído estas sandeces, somos mucho más felices que los 350 tiparracos estos…
Me temo que lo de hoy es puro cotilleo barato, lo más rancio de la España cañí. Vamos, de porteras!!! Mañana mejoraré, te traeré cosas mejores y más bonitas, cosas del alma, lo prometo… (aún te debo contarte mi conversión, pero tengo algún reparo…)