Yo creo que será una mera corrección, necesaria, pero dudo que sea un derrumbe ya que no hay mucha alternativa en bonos… Mira como lo ven por ahí:
With the US stock market likely to continue its levitation today, it means that by close of trading, the S&P500 will be above 2,400, the same as Goldman's year end price target, and 100 points away from Bank of America's "euphoric blow off top" destination, which is also known as Michael Hartnett's Icarus Trade. In a note released overnight, Hartnett confirms that he is "sticking with our “Icarus Trade” targets: SPX 2500, GT30 3.5%, DXY 110, oil $70/b", even as he admits that the euphoria level in stocks is unprecedented:
+ Yes, markets are increasingly overbought (it’s now 96 trading days since SPX fell;1% in one session).
+ Yes, sentiment is increasingly bullish (our Bull & Bear Indicator is 7.0, close to the 8.0 sell-signal).
+ Yes, the easy money has been made. But we believe a March Fed rate hike at a time of booming macro data will cause the bears to fully capitulate into risk assets, causing the melt-up toward our targets in Q2.
He also notes that the renewed jump in bond yields is coinciding with renewed outperformance by small cap & banks, and by high yield bonds vs. investment grade bonds, "thus we are willing to remain long risk assets for a little longer."
However it is what happens after this blow off top phase that is more interesting: that is the moment the "Icarus" trade becomes the "Humpty Dumpty" trade.
According to bank of America, "the “great fall” in risk assets comes when hawkish Fed & weaker EPS combine." That particular fusion will take place in H2, which is when Harnett says it will be time to get out...

The Fed has hiked just 2 times in the past 10 years. On March 15th the Fed will likely tighten for the 2nd time in 3 months. A second rate hike in 3 months would cause markets to anticipate a hike each quarter in 2017, and a jump in the Fed funds rate to 1.5-2% by early 2018.
As if that wasn't enough, March 15th is also the date of the Dutch election, and also when the US debt ceiling will be - hopefully - reinstated and immediately surpassed.
However, it is the Fed's tightening that is the biggest concern to BofA: "this acceleration of US financial tightening is a huge deal, and could in time become hugely negative. (In contrast, there were 35 Fed rate hikes in the 1970s, 28 in the 1980s, 11 in the 1990s, 20 in the 2000s – Table 1)."

Historically, once the Fed starts tightening, it keeps tightening until there is a “financial event” (Chart 4). This is likely to occur at a much lower rate of interest in the past given the economy & market’s reliance on QE in recent years,

Another warning from an increasingly concerned Hartnett: extreme US rate differentials can cause financial instability. US-German 2-year rate differentials are currently at 28-year highs (Chart 5). Rate differentials this wide have in the past either required either policy intervention (Plaza Accord in 1985) or have coincided with bad “events” (1987 crash, 1997 Asia crisis).

Putting it all together, BofA writes that "while for the moment we remain tactically bullish, we need to acknowledge the vulnerability of risk once the Fed gets going raising rates, to the extent that they coincide with a bear flattening of the yield curve and lower EPS expectations (see Investment Clock above). Like Humpty-Dumpty, risk assets will invariably have a great fall once the “wall of worry” is climbed and investors stop worrying.:
After all:
The current US equity bull market is already the 2nd longest ever, and will become the longest ever if it runs past August 22nd 2018; and the bull market will become the 3rd largest ever at 2467 on the S&P500.
At some stage in coming months our Bull & Bear Indicator will likely exceed the “greed” threshold of 8 (Chart 6)

Private client exposure to stocks will likely reach new all-time highs (current equity allocation is 60%, not far from Mar’15 peak of 63% - Chart 7); note their exposure to debt has already fallen to 12-year lows

Meanwhile, with US consumer confidence at 15-year highs, small business optimism at 12-year highs, US ISM at a very high 58, and European PMI’s at 6-year highs, the run of better-than-expected data may end by this summer.
Abrazos,
PD1: No podemos olvidar que las bolsas estadounidenses están caras, pero no así las demás…
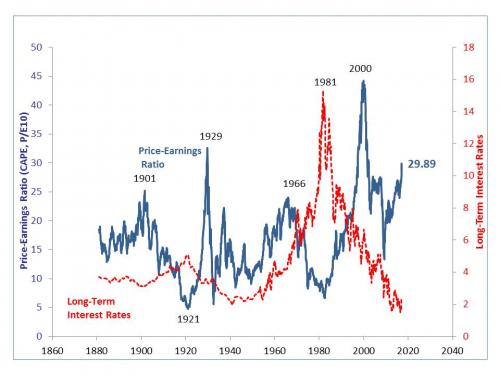
Summary: The best argument for avoiding US stocks is simple: valuation. Using the Shiller PE Ratio (price divided by a 10 year lookback at earnings), domestic equities trade for 29.9x earnings versus a long run average of 16.7x. The last time they were this expensive was early 2002, or 15 years ago. So how have they done since? The S&P 500 has appreciated 116% (a 5.3% CAGR) since February 2002 on a price basis. With dividends reinvested, that return jumps to 175% (a 7.1% CAGR). Not bad, but not the 9.5% average return from 1928 – 2016 either. As for how we got here, look to Consumer Discretionary (up 197% on a price basis), Health Care (+172%) and Energy (+170%). The largest drag was Financials, up only 10.0% since February 2002. But if the long term is a pretty good story, consider that 1) equities were down 22.0% in 2002 and 2) part of the appreciation over the last 15 years is due to exceptionally low long term interest rates. To get a similar outcome over the next 15 years, earnings growth may be the only driver.
According to the US Government, I will live to the ripe old age of 82.4 years. If I can make to age 62, however, that buys me 3 more years and I will expire halfway through 85. And if I make it to 70, I can tack on almost another year on top of that, within sight of 90. If you would like to see your own expected life span, just click here for the Social Security Administration’s “Life Expectancy Calculator”: https://www.ssa.gov/cgi-bin/longevity.cgi
My goal, therefore, is to get to 62 years old in decent health. Statistically, that is the easiest way to tack on a few more years of life. And it fits with my mantra on such matters: “The purpose of life is to stay alive.” Or, as my doctor tells me, “You’re a guy. If you can make it to 60, you can make it to 80”.
Equity market valuations play a similar role in estimating future returns – essentially they are one measure of the potential longevity of any given bull or bear market. High valuations point to lower future returns; lower valuations hold the promise of better future returns. Given that low valuations tend to occur during periods of economic and capital markets turmoil when asset prices (and investors) are depressed, this all makes good intuitive sense. Or, as the old trading saw goes: “Instead of crying, you should be buying.”
One measure of current US stock market valuation is the Shiller PE, which is simply the price of the S&P 500 divided by the average earnings of the index over the prior decade. Here’s how it looks right now:
+ As of the close today the Shiller PE stands at 29.89x earnings.
+ This is well above the long run (back to 1880) average of 16.7x.
+ It is also quite close to the 30x multiple of the Black Tuesday crash of 1929, and looks quite a bit like the valuations of the dot com bubble of the late 1990s.
+ You can see the chart here and also get the data in tabular form: http://www.multpl.com/shiller-pe/
There are two problems with crying “Fire” in the theater over this number. First, it is not exactly a clean data set. The accounting rules over earnings have changed a lot in the last 100 years, after all. Second, interest rates play a critical role in equity market valuations, and the Shiller PE ignores them entirely. With long rates as low as they are you would expect to see very high equity market valuation. That’s just math.
Still, there is some good work out there on how Shiller PEs can inform our perspective on future returns. Cliff Asness of AQR wrote one piece back in 2012 where he looked at 10 year returns on US stocks based on the starting Shiller PE. Here is what he found:
+ There is a direct and linear correlation between the Shiller PE and future equity market returns. If you bought US stocks when that measure was below 12, your average 10 year real rate of return was just over 10% (going back to 1926).
+ Conversely, if you bought when the Shiller PE was over 25 (as it is now), your average real 10 year return was just 0.5%.
+ You can read the paper here, by clicking “Download” (it is 9 pages long, but very readable): https://www.aqr.com/library/aqr-publications/an-old-friend-the-stock-mar...
We can take this analysis one step further, and look at what happened the last time the Shiller PE was close to 20; conveniently, it was 15 years ago – right at the start of 2002. What’s happened since? A few points:
-The S&P 500 is up 116%, or a 5.3% compounded annual growth rate (CAGR) over the last 15 years.
-If you reinvested dividends as paid, those returns jumps to 175%, or a 7.0% CAGR.
-While nicely positive, a 7.0% total return over the last 15 years is below the 9.5% CAGR of US stocks from 1928 – 2016 or the 11.5% CAGR from 1967 – 2016.
-It therefore seems that Shiller’s PE worked as expected in forecasting returns from February 2002 to now; they were lower than expected.
-You can see a detailed record of annual returns for the S&P 500, 3 month T Bills and 10 Year T Notes here, back to 1928: http://pages.stern.nyu.edu/~adamodar/New_Home_Page/datafile/histretSP.html
-If you want to see a very user friendly historical total return calculator for the S&P 500, check this out: https://dqydj.com/sp-500-return-calculator/
So if you had gone all-in on US stocks the last time the Shiller PE was this high and waited 15 years, you would have more than doubled your investment. Yes, you would have had to live through some pain first. The S&P 500 was down 22.0% in 2002, after all. And then there was 2008, down 36.6%. On the plus side: over the last 15 years those (2002 and 2008) are the only down years for the S&P 500.
So how did we get a 7.0% averaged compounded growth rate from a relatively high starting point for US stock valuations? Here’s how:
+Three sectors really killed it, but probably not the ones you think. They were Consumer Discretionary (+197% over the last 15 years), Health Care (+172%), and Energy (+170%). Yes, Technology did fine (+142%), but not as well as you’d think given the starting point of 2002.
+One did not: Financials, only up 10.0% on a price basis.
+Volatility over the last 15 years has, on average, been no different from the last 27 years. The average daily close for the VIX since 2002 has been 19.7. Over the longer run, that average is 20.
+The sharp eyed reader will say “Tell me about Netflix, Amazon and Priceline – they are technically Consumer Discretionary stocks, even though they are probably more correctly Tech companies”. And you’d be right. Netflix went into the S&P 500 in December 2010 and is up 411% since then, adding almost $50 billion of market value over that time. Amazon joined the S&P 500 in November 2005, when its price was $44. It is now $845/share, adding just over $350 billion of market value since its inclusion. Priceline went into the S&P 500 in late 2009, and is up 697% since then, adding $75 billion in market cap.
Can history repeat itself over the next 15 years? The Shiller PE of today is exactly where it was 15 years ago, after all, and things worked out fine. A few final thoughts:
-The missing piece of this puzzle is the direction of interest rates over the next 15 years. Back in March 2002, the US Treasury 10 year note yielded 5.42%. Now, that yield is 2.31%.
-The effect on valuation between those yields is profound. Take a perpetuity of $100 as an example. At a discount rate of 5.42%, it is worth $1,845 ($100 divided by that rate). At 2.31%, it is worth $4,329, or more than twice as much. Yes, equity valuation math has some wrinkles to it that make the math fuzzier, but you get the idea. Lower rates inflate financial asset prices a lot.
-The other factor to consider is earnings growth. S&P 500 earnings have been flat for 3 years at $117-$119/share. If the “Trump Trade” has one fundamental effect on US corporations, it must be to break that stagnancy. Over the 15 years we’ve tracked in this note, S&P 500 earnings grew by a compounded rate of 7% annually ($46/share in 2002 to this year’s expected $130/share).
That, along with lower rates, is what allowed US stocks to break the drag of a high Shiller PE back in early 2002. For the next 15 years, however, earnings will almost certainly have to go it alone if stocks are to replicate the performance of the last decade and a half.
PD2: Es un tema de ciclos, que se repiten sistemáticamente…
In this past weekend’s missive, “Visualizing 10-Reasons For Caution,” I presented a chart heavy analysis of why the current market is likely due for at least a short-term correction.
There is little doubt currently “exuberance” is running high following the election of Donald Trump. The hopes for stimulus, tax reform, and repatriation has “hope” springing that job and economic growth will follow. The problem, as I have discussed previously, is this optimism comes at a point in history diametrically opposed to when President Reagan instituted many of the same conservative policies.
It is this exuberance that reminded me of the following “investor psychology” chart.

This chart is not new, and there are many variations similar to it, but the importance should not be lost on individuals as it is repeated throughout history. At each delusional peak, it was always uttered, in some shape, form or variation, “this time is different.”
Of course, to the detriment of those who fell prey to that belief, it was not.
As I was studying the chart, something struck me.
During my history of blogging and writing newsletters, I have often discussed the importance of full-market cycles.
“Long-term investment success depends more on the WHEN you start investing. This is clearly shown in the chart below of long-term secular full-market cycles.”

“Here is the critical point. The MAJORITY of the returns from investing came in just 4 of the 8 major market cycles since 1871. Every other period yielded a return that actually lost out to inflation during that time frame.”
By looking at each full-cycle period as two parts, bull and bear, I missed the importance of the “psychology” driven by the entirety of the cycle.
In other words, what if instead of there being 8-cycles, we look at them as only three?

This would, of course, suggest that based on the “psychological” cycle of the market, the bull market that began in 1980 is not yet complete.
Notice in the chart above the CAPE (cyclically adjusted P/E ratio) reverted well below the long-term in both prior full-market cycles. While valuations did, very briefly, dip below the long-term trend in 2008-2009, they have not reverted to levels either low or long enough to form the fundamental and psychological underpinnings seen at the beginning of the last two full-market cycles.
What If The 80’s Secular Bull Is Still Running?
It is from that basis, and historical time frames, that I have created the following thought experiment of examining the psychological cycle overlaid on each of the three full-cycle periods in the market.
The first full-market cycle lasted 63-years from 1871 through 1934. This period ended with the crash of 1929 and the beginning of the “Great Depression.”

The second full-market cycle lasted 45-years from 1935-1980. This cycle ended with the demise of the “Nifty-Fifty” stocks and the “Black Bear Market” of 1974. While not as economically devastating to the overall economy as the 1929-crash, it did greatly impair the investment psychology of those in the market.

The current full-market cycle is only 37-years in the making. Given the 2nd highest valuation levels in history, corporate, consumer and margin debt near historical highs, and average economic growth rates running at historical lows, it is worth questioning whether the current full-market cycle has been completed or not.

The idea the “bull market” which begin in 1980 is still intact is not a new one. As shown below a chart of the market from 1980 to present, suggests the same.

The long-term bullish trend line remains and the cycle-oscillator is only half-way through a long-term cycle. Furthermore, on a Fibonacci-retracement basis, a 61.8% retracement would current intersect with the long-term bullish trend-line around 1000 suggesting the next downturn could indeed be a nasty one. But again, this is only based on the assumption the long-term full market cycle has not been completed as of yet.
I am NOT suggesting this is the case. This is just a thought-experiment about the potential outcome from the collision of weak economics, high levels of debt, and valuations and “irrational exuberance.”
Yes, this time could entirely be different.
It just never has been before.
Indexing Realities
Daniel Drew had a very interesting post this past week discussing the realities of indexing. To wit:
“Warren Buffett released his annual letter over the weekend, in which he praised Jack Bogle as his ‘hero’ for promoting index investing. The irony is that investors would have been better off buying Berkshire shares. Over the last 10 years, Berkshire stock is up 139% while the S&P 500 is up 71%.
Buffett is doing something every skilled salesman does: managing expectations. Buffett’s own performance is compared against the S&P 500, and what better way to win that game than by putting a floor under the Berkshire price with the promise of share buybacks and then putting a ceiling on the stock by promoting index investing? The real secret is Buffett is talking his book by not talking it: Rather than tell investors to buy Berkshire at any price, he tells people to invest passively through an index, which leads to the very market inefficiencies that he profits from.
The great appeal of index investing is its low fees, but like buying a cheap pair of shoes that falls apart after 6 months, investors will find that index investing is the most expensive thing they ever did.
Vanguard promotes its rock-bottom expense ratios, but what is not published is market impact costs that are incurred when the fund rebalances. Since these rebalances are often announced ahead of time, they are extremely vulnerable to front running. Christophe Bernard, Ph.D. Senior Scientist at Winton Capital Management, estimates that front running costs index investors 0.20% per year. That’s 4 times the official expense ratio of Vanguard’s S&P 500 ETF.
In his latest research, finance professor Hendrik Bessembinder discovered that 58% of stocks don’t even outperform a Treasury bill. This study was based on 26,000 stocks from 1926 to 2015. Just 4% of stocks accounted for all of the $31.8 trillion in gains during this period. That means 96% of stocks were complete garbage. Even worse, shares of unprofitable companies outperform their profitable counterparts, which is why you have a marketplace that is dominated by Twitters and Teslas.
Index investing means buying a box of garbage stocks sprinkled with a few hope and glamor stocks whose price gains are solely a result of underperforming fund managers grasping for quarterly bonuses and retail investors juicing up their portfolios in a doomed attempt to catch up on their retirement targets.
While mom and pop buy a Vanguard index with their $500,000 and get front run all day by proprietary traders, the capitalist televangelist Warren Buffett will continue to actively trade billions while preaching the miracle of buy and hold investing.”
Just something to think about.
PD3: No te empeñes en ser conocido, sino en ser alguien que vale la pena conocer. Muestra tus valores…, tu alegría, tu ternura, tu cariño, tu bondad.