Hoy me enrollo un montón y te mando incluido en este el del viernes que hago puente. Espero darte una perspectiva a largo plazo de EEUU:
The Reluctant Recovery: Part 1
This is the title of a presentation I gave October 10th to The Economic Club of Sheboygan. This post summarizes the key points of the presentation, and is the first in a series. In this first part, the main focus is on the message of key market-based indicators. Some suggest that the economic fundamentals have improved significantly, but others suggest that investors are still very reluctant to believe that this improvement will last. Long-time readers of this blog will recognize almost all of the charts and the themes laid out here.

Swap spreads are excellent leading indicators of economic health, as the above chart demonstrates. (Here is a primer on swap spreads.) Swap spreads can be thought of as the price that market participants must pay to reduce their exposure to risk. When swap spreads rise, it's because investors are becoming more worried about the future, the market is becoming more risk averse, liquidity is drying up, and/or the economic fundamentals are deteriorating. As a result, it becomes more expensive to get rid of unwanted risk. Swap spreads have risen in advance of the last three recessions, and they have declined in advance of the last two recoveries. The decline in swap spreads in late 2008 led me to predict improving conditions in 2009. Today, swap spreads are about as low as they get, and that suggests that systemic risk in general is very low, and therefore the health of the economy is likely to improve over the next six months.

Systemic risk has declined significantly. To judge by the decline in Eurozone swap spreads, conditions in the Eurozone have improved dramatically so far this year. This reflects serious efforts on the part of the ECB to improve liquidity conditions. When markets are liquid, they can function normally and fulfill their role as a "financial shock absorber" to the economy. A good way to understand this was the "Carmageddon" episode in Los Angeles over a year ago. As I wrote at the time, when people have access to information and an incentive to act on it, they will. In short, the entire population of Los Angeles was well aware that the closure of the 405 freeway could create epic traffic jams, and so people decided to stay at home. The result was no traffic problems at all. And so it was with the Eurozone sovereign debt crisis: when Greece finally defaulted, it caused barely a ripple in the financial markets, because everyone had had plenty of advance warning and those who didn't want to be exposed to Greek default risk were able to transfer their risk to those that did. With liquidity having returned to markets nearly everywhere, investors are becoming somewhat less concerned about the future and that has helped conditions in the U.S. to improve.

The usual precursors of recession are absent. As the above chart shows, every recession in the past 50 years has been preceded by very high real interest rates (the blue line, representing the real Fed funds rate) and by a very flat or negatively-sloped Treasury yield curve (the red line, representing the slope between 1- and 10-yr Treasury yields). High real interest rates are the tool that the Fed uses to slow the economy and damp inflation. They tend to increase the demand for money, punish borrowing, and reward saving, and they signal that money is in relatively short supply. Today the Fed is trying very hard to do exactly the opposite; by keeping real rates very low and negative, the Fed wants to decrease the demand for money, reward borrowing, and punish saving, by making sure that money is plentiful. The bond market steepens the yield curve when it knows that the Fed is very easy and will eventually have to tighten, and it flattens the yield curve when it knows that the Fed is very tight and will eventually have to ease. Today it is clear that the Fed is easy and money is in plentiful supply. Both of these classic indicators of recession and recovery signal strongly that we are still likely in the expansion phase of the current business cycle.

Negative real yields imply dismal growth expectations. Despite the evidence of improvement in key financial indicators (e.g., low swap spreads, a steep yield curve, negative interest rates), the market's expectations for growth remain dismal. The above chart shows that there is a tendency for real yields on TIPS to track the real growth rate of the economy. This is only common sense. When the economy was growing very strongly in the late 1990s and early 2000s, the real yield on TIPS was extremely high. TIPS in effect had to compete with the widespread perception that real yields on just about everything were likely to be strong. Today it's just the opposite. Negative real yields on TIPS are a sign that the market expects real economic growth to be very weak. Investors are willing to sacrifice some of their future purchasing power (by locking in negative real yields on TIPS) because they fear that returns on alternative investments could be far worse. The chart above suggests that the economic growth expectations embedded in TIPS prices could be as low as zero for the next several years.

Credit spreads are still elevated. Credit default spreads on investment grade and high-yield corporate bonds are still substantially higher than they were prior to the onset of the last recession. Even though default rates have fallen significantly and the economy has been growing for the past three years, and key indicators of systemic risk are looking very encouraging, the market is still very worried about the future.

Major bear markets leave investors shell-shocked for years. The two major bear markets in our lifetimes—from the mid-1960s to the early 1980s, and from the early 2000s to the late 2000s—resulted in equity prices falling by roughly two-thirds in real terms. As the saying goes, "once burned, twice shy." Market participants are still very afraid of getting back into the market, worrying instead that another sell-off could be just around the corner. As they say, "bull markets climb walls of worry." It is only natural for markets to still be very worried about the future. There are no obvious signs of excessive optimism to be found these days. Rather, it's much easier to find signs of pessimism.

PE ratios are below average. Continued concerns about the future are also reflected in the trailing PE ratio of the S&P 500, which is below its long-term average. The market was exceedingly optimistic in 2000, when PE ratios soared to 30, but today pessimism is the default position. The market is reluctant to trust that profits will continue growing, or even maintain current levels.


Equity yields tower over corporate bond yields. despite record profits. Normally, the earnings yields on stocks is lower than the yield on corporate bonds. That's because equity investors are usually willing to give up some yield in exchange for the expectation of future capital gains. Today, however, the earnings yield on stocks is much higher than the typical yield on corporate bonds. This can only mean that the market is very worried that earnings will fall in coming years—perhaps falling in mean-reverting fashion to 6% of GDP or thereabouts—and thus prefers to own corporate bonds at a much lower yield because they are higher in the capital structure and thus more immune to adversity.

In a global context, profits look sustainable. While it's very tempting to look at profits as a % of U.S. GDP and conclude that they are so high they can only fall by a lot, the above chart suggests that profits as a % of global GDP are not very high at all and could be quite sustainable at current levels. The U.S. economy has become so much more internationalized that it is a mistake, I believe, to confine one's analysis to the U.S. economy. Companies today (e.g., Apple) are able to address global markets that are growing by leaps and bounds. It is not at all unreasonable to find that corporate profits have also been growing at a much faster rate than the U.S. economy, and there is little reason to suspect that this will change any time soon. Even if corporate profits stopped growing, PE ratios would still be low by historical standards, and very low in the context of extremely low Treasury yields.
The Reluctant Recovery: Part 2
In this second part, the main focus is monetary policy. I argue that the Fed has correctly responded to the huge increase in the demand for safe-haven dollar liquidity that was caused by the Great Recession and the Eurozone debt crisis. However, the measures they have taken are so unprecedented and so potentially inflationary that they have introduced a significant amount of uncertainty to the market, and this in turn has contributed to the market being reluctant to believe that the current recovery is sustainable.

Quantitative easing has been accomplished so far by the Fed purchasing $1.6 trillion of Treasuries and MBS, in three stages. QE3 has only recently begun, and it is still relatively modest in size, with purchases scheduled to be about $40 billion per month. These purchases have been paid for not with cash, but with bank reserves. Since the Fed decided to pay interest on bank reserves early on in the quantitative easing process, bank reserves are functionally equivalent to T-bills since they are almost as risk-free and yield a little more (currently the Fed pays 0.25% on reserves, which is a bit more than the 0.09% yield on 3-mo. T-bills). This is very different from how things worked in the past, when reserves paid no interest and banks therefore had a strong incentive to use additional reserves to expand lending. In effect, the Fed has swapped $1.6 trillion of T-bill equivalents for $1.6 trillion of notes and bonds. The Fed has not "printed money" in massive quantities as so many have been led to believe. The Fed has merely supplied an asset to the market that was in very high demand (i.e., T-bill equivalents whose price was so high they yielded almost nothing) in exchange for an asset that was in less demand (i.e., notes and bonds with lower prices and higher yields).

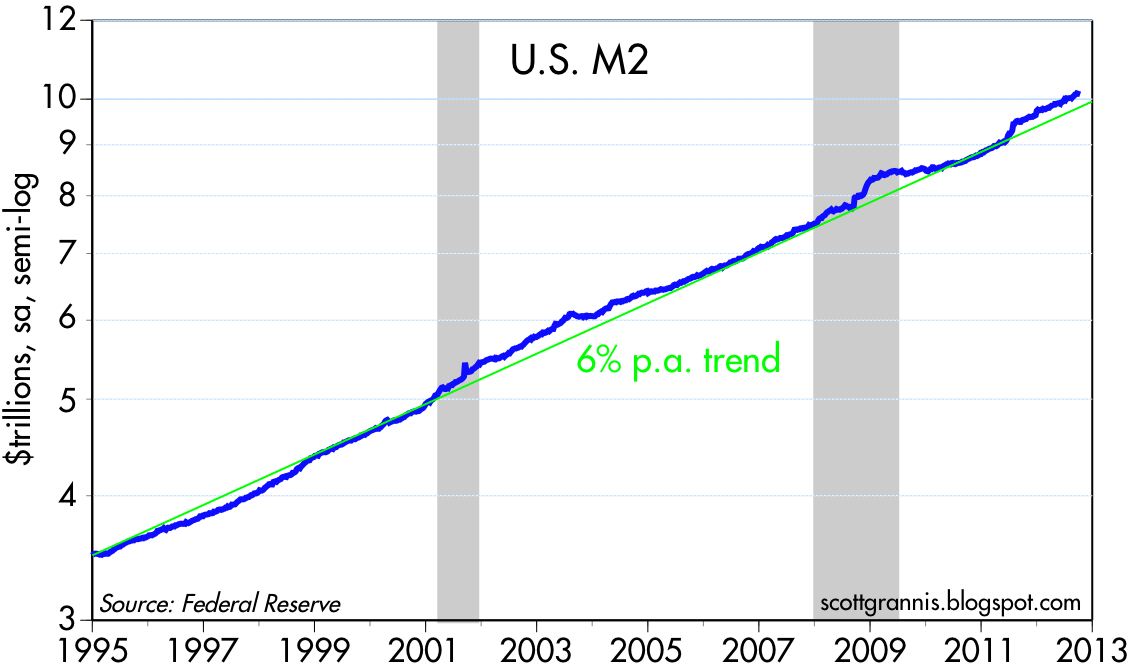
Quantitative easing was necessary to accommodate increased money demand. When analyzing monetary policy, it is critical to establish whether the Fed's willingness to supply money is greater, lesser, or equal to the world's demand for money. If money supply exceeds money demand, the result is inflation (e.g., too much money chasing too few goods and services). If money supply is less than money demand, the result is deflation (e.g., a shortage of money relative to goods and services). If supply and demand are in balance, the result is monetary nirvana—low and stable inflation. As the chart above shows, the demand for money (M2 is the best proxy for "money" that I am aware of, and comparing M2 to GDP is a good way to see how much money people want to hold relative to their incomes and their spending) skyrocketed beginning with the collapse of Lehman Bros. in late 2008. In effect, the world's demand for money soared; people wanted to save more, spend less, increase their cash balances, and reduce their debt.
In the chart above, the increase in the ratio of M2 to GDP from September '08 through today is the equivalent of approximately $1.5 trillion in additional M2 growth. It is not a coincidence that the world's extra demand for money, sparked by fears of a global financial collapse and/or a global economic meltdown, was of the same order of magnitude as the Fed's injection of $1.6 trillion of bank reserves. The Fed bought $1.6 trillion of notes and bonds and paid for them by crediting banks with bank reserves; a portion of those reserves were eventually exchanged for currency, which has increased by about $300 billion; about $100 billion of those reserves were used by banks to back up increased deposits; and the rest of the reserves found their way back to the banks, who were content to just hold on to them in the form of "excess reserves." Banks were risk-averse too, after all, and reserves were a safe asset that paid at least some interest.

Most M2 growth went to deposits. The chart above shows the different components of the M2 measure of money, with the largest by far being savings deposits. It is not a coincidence that savings deposits account for virtually all of the increase in M2 since the Lehman Bros. collapse. Savings deposits have increased by about $2.5 trillion over the past four years, with $1.5 trillion of that increase going towards satisfying the public's hugely increased demand for money. In short, all of the extra "money" that the Fed created in the form of bank reserves ended up in the banking system. It never made it into the economy.
Money growth has not been excessive by past standards. As the chart above shows, M2 in the past four years has grown only marginally faster than it has on average over the past 17 years. Accelerations and decelerations in M2 growth happen all the time, and the last two—driven by increased money demand—don't appear unusual at all. When inflation was rising in the 1970s, M2 growth was averaging close to 10% per year. M2 growth over the past four years has been an annualized 6.4%, and that is just not enough to fuel a significant rise in inflation.

Benign inflation confirms this. Both the headline and the core version of the Personal Consumption Deflator are within the Fed's target of 1-2%. Although inflation has been unusually volatile in the past decade or so, on average it has not been problematic. This strongly suggests that the Fed's efforts to expand the money supply have been matched by the market's increased demand for money. If the Fed had not launched Quantitative Easing, we would probably have seen deflation by now.

However, inflation expectations are rising. The above chart shows the forward-looking inflation expectations that are embedded in the pricing of TIPS and Treasuries. Inflation expectations have been rising in recent months, but they are still only moderately elevated compared to historical experience. I think this reflects emerging fears on the part of the bond market that the Fed is likely to make an inflation mistake in the future, and that is a very legitimate concern.

The dollar is extremely weak. The above chart shows the value of the dollar against large baskets of other currencies, adjusted for differences in the inflation rate between the U.S. and those other countries. It is arguably the best measure of the dollar's value vis a vis other currencies. That the dollar is very close to its all-time low suggests that the currency market also is feeling uneasy about the Fed's stewardship of the dollar. At the very least it suggests a serious lack of confidence in the future of the U.S. economy. The Fed may have done an excellent job accommodating the world's demand for safe-haven dollars to date, but in the process they may have undermined the world's confidence in the value of the dollar going forward.

Gold and commodities are very strong. Gold and commodity prices have risen significantly in the past 10 years, beginning with the Fed's initial efforts to ease in response to weak recovery that followed the 2001 recession. This is basically the flip side of the dollar's general weakness following its peak in 2002. The world's demand for dollars has been eclipsed by an increased demand for physical assets, which in turn is symptomatic of the beginnings of a rotation out of financial assets that could fuel future inflation. Recall that the sharp rise in inflation in the late 1970s followed a sharp rise in gold and commodity prices in the first half of the 1970s. Gold, which is up strongly relative to every currency, is sending a strong signal that the world is concerned that inflation is going to rise.
Inflation has not risen yet, but that is mainly due to the fact that the demand for dollars has been very strong, and that increased demand has been driven by fears, uncertainty, doubt, and a general lack of confidence in fiat currencies. If confidence in the future increases, the demand for dollars is likely to decline. Will the Fed be able to reverse its quantitative easing and/or increase the interest rate paid on reserves in a timely fashion, enough so as to prevent an excess of dollars—and a significant rise in inflation—from occurring? That is the biggest question lurking beneath the surface today. If the demand for M2 should decline, there is the potential for a $1.5 trillion—or more—excess of dollars to develop. Looked at another way, there is $1.5 trillion sitting in bank savings deposits that could be spent, and banks' excess reserves could be used to make new loans and expand the money supply almost without limit. If the world just attempted to reduce its holdings of savings, $1.5 trillion could find its way into higher prices for goods and services, and that could fuel some significant inflation, and perhaps some additional growth, in the years to come.
In short, it's understandable that markets are reluctant to believe that things will continue to improve.
The Reluctant Recovery: Part 3
In this third part, the main focus is fiscal policy. I argue that Congressional deadlock has allowed the growth in federal spending to slow significantly, with the result that there has been a welcome decline in spending relative to the economy; and that economic growth has increased federal revenues without any increase in tax rates. This has combined to reduce the burden of the deficit substantially. From this it is easy to see a simple and straightforward solution to our trillion-dollar deficit nightmare: continue to exercise spending restraint, avoid increasing taxes, and broaden the tax base by reducing deductions and loopholes.

To begin with, it's important to understand that we are indeed in the midst of a fiscal debt crisis. As the chart above shows, the burden of the federal debt (measured by comparing outstanding federal debt held by the public to nominal GDP) has increased by much more during the Obama administration than it has during any previous post-war administration. By early next year the federal debt burden will be over 70% of GDP, having risen from 46% in early 2009. The impact of the rapidly increasing debt burden has been muted by the fortuitous fact Treasury yields have fallen to their lowest levels in history. This could change dramatically for the worse, of course, if the economy and/or inflation picks up in coming years, since higher interest rates combined with the relatively short maturity of existing federal debt could make federal debt service payments soar even if deficits were to decline meaningfully.


The first chart above shows federal spending and revenues as a % of GDP, while the second shows the nominal level of each. Government spending has declined relative to GDP mainly because the growth in spending has slowed sharply as the economy has grown. Slower growth in spending owes much to a gridlocked Congress, and also to improvement in the labor market, since 6.8 million people have dropped off the unemployment insurance rolls since early 2010. Revenues have increased much more than spending has declined, thanks mainly to the growth of the economy, which in turn has generated more jobs and more corporate profits. We didn't need to raise tax rates to increase tax revenues, because economic growth caused the tax base to expand. In fact, tax revenues have risen even though social security contribution rates have been reduced for most of the past two years (i.e., the "payroll tax holiday"). Unfortunately, liberals seem to be dug in on the need for higher tax rates on the rich and more income redistribution, both of which could weaken the economy and aggravate the budget problem.

Thanks to slower growth in spending and a moderate increase in the size of the economy, the federal deficit has shrunk rather dramatically from a high of 10.5% in late 2009 to about 7% today. The 2012 fiscal year deficit came in at $1.089 trillion, however, which is still mind-boggling. The bad news is that the deficit is still very large; the good news is that it's declining.

Tax revenues are likely to rise further if the economy continues to grow, so that side of the ledger will likely take care of itself. But on the spending side we have two looming problems: payments to individuals and net interest expense. Both are likely to rise meaningfully if and when Obamacare is implemented and if and when Treasury yields rise. Payments to individuals (aka transfer payments) already consume a huge portion of the budget (over 70%), and this category has been growing like Topsy for the past 50 years. Social security, medicare, medicaid, food stamps, etc.; are all non discretionary items that could continue to expand without practical limit unless Congress reforms the underlying programs and their eligibility requirements. As for net interest expense, it is very hard to see how this won't increase significantly; only a continuation of painfully slow growth could keep interest rates from rising, and the deficit is going to be very large no matter what for at least the next several years.
So although the budget picture has definitely improved in the past few years, we are not yet out of the woods. The deficit is still very large, as is the burden of federal debt. But the most important part of the budget, as Milton Friedman taught us, is spending. Spending is the best measure of the burden of government, and it is still at very high levels relative to the economy. Government at the federal, state, and local levels still consumes a huge share of our nation's output, and that is like a ball and chain to economic progress, because government simply can't spend money as efficiently as the private sector can. The only hope for stronger growth and rising prosperity in the years to come is a substantial shrinkage in government spending, and that can come only from fundamental reforms to our many entitlement programs.
In the meantime, it is easy to see how investors and corporations are reluctant to believe that there won't be a big increase in future tax burdens, and reluctant to believe that there will be significant relief from the overall burden of government. Fiscal policy is like a big storm cloud on the horizon. There is still time to avoid disaster, but there are many obstacles on the road to prosperity.
The Reluctant Recovery: Part 4
In this fourth part, the main focus is the state of the economy. I argue that although this is the weakest recovery in generations, with a few exceptions the economy has undergone some significant adjustments and is continuing to expand, although growth is likely to continue to be rather slow and disappointing until and unless we get significant improvement in fiscal and monetary policy.

This chart is plotted with a logarithmic y-axis (as are many of my charts) in order to highlight the trend rate of growth of the economy, which for most of the past 50 years has been about 3% per year. Recessions throw the economy off track, but it usually comes back to trend after a few years. I discuss this in more detail here. This recovery, however, has been miserable. This chart suggests the economy is about 12% smaller than it otherwise could have been if the recovery were "normal." That translates to almost $2 trillion in lost output or income. This very likely the weakest recovery ever, and I think it's due to the tremendous amount of fiscal and monetary "stimulus" that has been applied in the past several years. Fiscal "stimulus" that consists of a massive increase in transfer payments only weakens growth. In the same vein, monetary "stimulus" that consists of a promise to keep rates close to zero for years, and a commitment to keep banks flush with reserves, only stimulates speculative activity while also depressing savings. In addition, it creates tremendous uncertainty about the future value of the dollar. This all combines to weaken growth because it saps the confidence and the wherewithal to make major investment decisions.

The Eurozone has taken a big hit, but industrial production there appears to be recovering in recent months, as predicted by the huge decline in Eurozone swap spreads so far this year. U.S. industrial production has been relatively stagnant this year, but there is no sign here of any collapse.

The above chart suggests that the recovery in the stock market has tracked the improvement in the underlying fundamentals of the labor market. As the pace of layoffs has dropped, equities have risen. This is my general thesis: the equity market has not been driven by rising optimism, but rather by declining pessimism. Equities have rallied reluctantly, since the economy has improved—albeit very slowly—in contrast to the very pessimistic assumptions embodied in equity prices and bond yields as I discussed in Part 1. The market's expectations, in other words, have consistently been for the economy to be in worse shape than it has actually been. The future, in other words, has turned out to be somewhat better than expected, and that is what has forced equity prices to rise, reluctantly.

The growth in jobs has been generally disappointing, but nevertheless the economy is still creating additional jobs, and there is no sign in this chart of the decline in jobs that traditionally marks a recession. We are still in the recovery phase of the business cycle, no matter how disappointing the recovery may be. With markets still braced for another recession (or worse), a continuation of modest growth should have a positive impact on equity valuations.

The chart above compares households' monthly financial payment obligations to disposable income. Thanks to rising incomes, higher savings, deleveraging, and mortgage defaults, households have significantly reduced their financial burdens in the past several years. Financial burdens today are about as low as they have been at any time in the past 40 years, in fact. Recessions are all about negative surprises and the adjustments they force. By this measure there has been a significant amount of adjustment, and that in turn lays the foundation for healthier growth in the future. All that's lacking at this point is confidence. People are still reluctant to believe that the future is bright.

The delinquency rate on credit cards and consumer loans in general has dropped considerably since the end of the recession, another sign that households are in much better financial shape these days.

In contrast to the general private sector deleveraging that has been underway in recent years, student loans are expanding at a rapid pace. This is the only category of consumer credit that has grown since the recession, in fact—consumer credit excluding student loans has actually declined by $240 billion since its peak in 2008. Student loans now account for 18% of consumer credit, whereas they were only 4% at the end of 2008. What accounts for this counterintuitive growth? The rapid growth started in early 2009, right around the time that the federal government essentially took over the student loan market. Virtually all of the increase in loans since that time has come from and is held by government agencies that have no qualms about suffering losses, since they are passed on to taxpayers. Like the housing market, which was force-fed with unaffordable loans that eventually went bust, the student loan market is a bubble in the making. The rapid growth in government-backed student loans is helping higher educational institutions to keep inflating their costs and their prices. This will likely end in tears (and defaults), with colleges and universities eventually forced to undergo the painful restructuring already experienced by the residential construction industry. The increase in student loan borrowing is not a portent of a stronger economy. There are still problems out there, and that's why everyone is reluctant to be optimistic about the future.

Auto sales are the very picture of a V-shaped recovery. Sales have increased at a 14.5% annualized pace since their recession low. Sales are still below "normal" levels, of course, but this kind of outsized growth has ripple effects throughout the economy. Sales have consistently exceeded forecasts, and this means that factories have no choice but to ramp up production and increase hiring. Real change happens when the unexpected occurs, and that is what is driving the auto industry.

Residential construction is now in the midst of a V-shaped recovery. Since early last year, housing starts have jumped by 60%, vastly exceeding virtually everyone's expectations. This also has positive ripple effects throughout the economy, and is a good sign that the housing bubble has burst. The necessary adjustments have been made (e.g., a significant decline in the inventory of new homes) to permit a return to growth. Residential construction could add as much as 1% per year to GDP growth over the next several years. It matters little that starts are still extremely low; what matters the most is the change on the margin, and that is very encouraging.

With construction rebounding, it's not surprising that housing prices are firming and even beginning to rise in many areas. The Radar Logic survey of housing prices shows they rose 5% in August compared to a year earlier. Housing today is more affordable than ever, thanks to extremely low mortgage rates and a 35% average decline in housing prices across the country in the past six years. But of course the consensus of opinion still appears to be dominated by a reluctance to believe that housing has really turned the corner—after all, there are still so many homeowners with underwater mortgages and so many foreclosed homes waiting to be sold. What the worriers ignore, however, is that while the supply of homes could increase, the demand for homes could increase as well, if confidence in the future were to increase.

The chart above shows that bank lending to small and medium-sized businesses is up over 22% in the past two years. Lending standards are still relatively strict, but banks are nevertheless lending more and relaxing lending standards on the margin. This is very encouraging because it reflects increased confidence on the part of both banks and businesses. Banks are more willing to lend, businesses in aggregate are more willing to borrow.

The chart above shows the fairly reliable relationship between the ISM manufacturing index and quarterly GDP growth. Manufacturing was one of the key sources of growth early in the recession, and although it is now less strong, the most recent index reading of 51.5 is still consistent with GDP growth of about 2%. The service sector version of this same index is currently at 55, and that too points to continued, albeit relatively slow, growth. Slow growth is disappointing, and there are many millions still out of work, but growing is better than not growing, and there is no sign at all in these key surveys of a recession.

Capital goods orders are a good proxy for business investment, which is the seed corn of future growth. Growth which produces rising living standards requires that we produce more with a given number of inputs. Productivity, in other words, is the source of real growth, and it requires investment in new plant and equipment, new computers, and new technology. The slowdown in business investment in recent months is disappointing, because it means growth in the future is likely to remain weak or weaken further. I think business investment has declined because of the growing uncertainty surrounding the "fiscal cliff" which is scheduled to arrive in just over two months; I don't think this is a harbinger of recession as it typically would be. Everyone knows that tax rates could soar in few months, and a drastic cut in defense spending could have negative ripple effects throughout many industries. No one knows at this point how this problem is going to be resolved; it could end up being very bad for growth or very good. This kind of binary uncertainty is likely inhibiting all sorts of decisions right now, contributing to the reluctance of investors and businessmen to embrace the equity rally and the economic recovery.
I'm optimistic that Washington and the electorate will arrive at a reasonable solution, but I can't be sure. Still, if I'm right and the markets are still braced for a recession, it's possible that even a suboptimal resolution of the fiscal cliff would fail to be unexpectedly bad news.
The Reluctant Recovery: Conclusions
If there is one unifying theme to my presentation, it starts with the title. I argue that the recovery has been a reluctant one, because the market has from the very beginning been reluctant to embrace the notion that the recovery was real and durable, much less robust. There are plenty of good reasons for the market to be concerned, of course: unprecedented changes in monetary policy, misguided fiscal stimulus, the deep-seated problems in the Eurozone, the housing disaster, and the huge federal deficit, among others.
In Part 1, I show how key market-based indicators reflect a significant improvement in economic and financial fundamentals (e.g., swap spreads, real short-term interest rates, the slope of the yield curve, corporate profits), but other indicators show that the market remains very pessimistic about the future (e.g., TIPS yields, credit spreads, PE ratios, equity yields). The fundamentals have improved, but market sentiment remains pessimistic. This creates an interesting environment for investors, since it means that the bar for economic performance has been set very low: the economy only needs to avoid a recession for markets to react positively.
In Part 2, I argue that monetary policy has correctly responded to a huge increase in the demand for safe-haven dollar liquidity that followed in the wake of the Great Recession. But since the Fed's response was not only unprecedented but gigantic by historical standards, this has created tremendous uncertainty. Will the Fed be able to reverse its Quantitative Easing in a timely fashion? Should we be bracing for a significant increase in inflation? Will the dollar, already very near its weakest level ever, go down further?
In Part 3, I point out that although the federal budget is in miserable shape, there have been encouraging signs of progress. Spending as a % of GDP has declined, thanks to Congressional gridlock. Revenues as a % of GDP have increased, thanks to slow but steady growth in jobs and incomes. As a result, the budget deficit has dropped from a threatening 10.5% of GDP to now only 7%. This points to a relatively simple solution for the future: maintain spending restraint, avoid increasing tax rates, reduce tax rates as much as possible, and pay for lower rates by broadening the tax base (e.g., eliminating or limitation tax deductions and loopholes). In other words, there is a growth-oriented solution to our fiscal problem that needn't be difficult to implement.
In Part 4, I find that although this is the weakest recovery ever, there are a number of areas in the economy that are improving, and only a few that point to further weakness. Households have undergone tremendous deleveraging, and are much more financially healthy than before. Corporations have cut costs to the bone and are now more profitable than ever. The housing market is turning up. Banks are lending more. The main obstacles to progress are the uncertainty created by misguided fiscal policy, unprecedented monetary policy, and the looming fiscal cliff.
So, the market has dreadful expectations for the economy, but the economy is displaying many classic signs of an ongoing recovery, albeit a very tepid and disappointing one. The bar of expectations has been set very low. If the economy avoids a recession and continues to recover, even very slowly, this likely would be a positive shock to the market. Investors willing to bet that we do in fact avoid a recession can therefore expect to profit by buying risk assets that are relatively cheap by historical standards.
What follows are general guidelines for investing in different asset classes.
Equities are relatively cheap, in my view, because corporate profits are very high, both nominally and relative to GDP, but PE ratios are below average. Moreover, equity yields are significantly higher than corporate bond yields (the earnings yield on the S&P 500 is currently about 7% vs. a yield of 4.5% on the average BAA-rated corporate bond), and both are orders of magnitude higher than the yield on cash, which is another way of seeing that the market expects profits to decline significantly. If profits merely stagnate, equity yields would still be very attractive compared to corporate bond yields and unbelievably attractive relative to cash. It might take an outright recession or worse to shock the equity market.
Real estate, particularly residential real estate, has fallen significantly in price, while at the same time the cost of buying real estate using extremely low mortgage rates is very cheap—historically cheap—relative to household incomes. In other words, the affordability of housing has almost never been so attractive. That's because the majority of people still expect real estate prices to decline, despite growing signs of a housing market recovery and rising prices. It's also likely that demand for housing is being suppressed because banks' lending standards are still much tougher than they were before the Great Recession. Undoubtedly there are many young homeowners who would like to buy a house but find that they lack the necessary down payment or job history. Nevertheless, "everyone knows" that there is a ton of foreclosed properties sitting on banks' balance sheets waiting to be sold, and there are millions of homeowners still underwater on their mortgages. The real estate market is still in the grips of caution, rather than exuberance.
Real estate is also potentially very attractive because it has traditionally been an excellent inflation hedge. If the Fed fails to reverse its Quantitative Easing in a timely fashion, inflation could rise significantly. Incomes would also rise in that case, and the demand for housing could rise hugely. We all learned in the 1970s that real estate (and any hard asset, for that matter) is a great thing to own, especially with leverage, when inflation is rising. Today, however, both real estate and mortgage rates are priced to the expectation that inflation will remain relatively low for as far as the eye can see.
What about other inflation hedges? Gold prices are extremely high, both in nominal and real terms, and commodity prices have risen substantially. These markets arguably are priced (by speculators) to the expectation that the Fed will make a big inflationary mistake. Maybe they will, but if they don't, gold in particular could tumble much as it did in the 1980s when tight monetary policy caused inflation to fall way below everyone's expectations. It's late in the game to load up on gold, because the world has been loading up on gold for the past decade, in the expectation that inflation will rise, the dollar will collapse, and/or the global financial system will collapse. Barring any of these disasters, gold might have very limited upside but a lot of downside potential.
Treasury yields, meanwhile, are extraordinarily low, making Treasury bills, notes and bonds extraoridinarily expensive. Investors everywhere are willing to hold Treasuries at historically low levels of yield because they are very fearful of the future. With real yields on TIPS deep in negative territory, this is one more sign that expectations for future investment returns, and for real economic growth, are dismal. Thus, holding Treasuries today only makes sense if you worry about an outright depression. If the economy picks up even just a little, and/or inflation rises by even a few percentage points, Treasury yields could rise (and their prices fall) by enough to wipe out many years' worth of income.
Corporate and emerging market debt have performed very well in the past several years, because spreads to Treasuries have narrowed from very high levels and default rates have fallen thanks to an improving economy. Investment grade spreads are still somewhat wide by historic standards, but their yields have never been so low (3-3.5% currently). High quality corporate bonds still offer yields that are a few points higher than Treasuries, but if Treasury yields rise, investment grade corporate debt is going to face challenging conditions (i.e., rising yields and falling prices). In other words, current yields offer very little protection from a rising interest rate environment should the economy improve. High-yield corporate bonds offer more protection against rising yields, since their spreads to Treasuries are still relatively generous and their yields are in the range of 6-7%, but high-yield debt is no longer the slam-dunk it used to be. The current appeal of high-yield debt is that if nothing changes it offers much higher yields than Treasuries, and if yields rise, then the negative impact of rising yields would likely be offset to some degree by declining default rates and by declining spreads to Treasuries. That's because higher yields would only occur if the economy improves and/or inflation rises, and both of those conditions would make high-yield debt more attractive.
Hoy ha sido super largo. Me parece interesante. Vivimos momentos complejos y no está mal dar una visión larga y dejarle al analista que se extienda…Un abrazo,
PD1: Mercado del petróleo: Es donde más se nota el declive de los países desarrollados (no sólo España ni los periféricos europeos van flojos, es todo Occidente), frente a la continua y fuerte demanda de los emergentes que provocan que los precios se mantengan en las nubes y nos cueste un huevo, con perdón, la gasolina y el gasoil…

Rusia irrumpe a producir (es el país que tiene los costes extractivos mayores y sólo saca petróleo si el precio es elevado:

La OPEP tiene una capacidad de producción muy similar cada año, está cerca de sus máximos y no se puede esperar mucho más por ahí:

Y los países que no son de la OPEP han ido incrementando sus volúmenes diarios gracias a nuevos descubrimientos…

Y los precios siguen estables, caros, pero estables. No se descuenta una entrada en recesión en el mundo global:

Petróleo sin descubrir, ¿quién lo tiene? Coño, China de nuevo, ¡¡¡joder qué suerte!!!

Y el gas sin descubrir: Rusia, todo para Rusia…

PD2: ¿Estamos enganchados? Yo algo…; bueno no, bastante. Me tengo que desintoxicar como sea: paseos, buenos libros, charla, familia, rezos…, lo que sea pero no entrar a ver mi correo…, ni lo que hacen los mercados. Tengo mono, mucho mono. Internet es un asco.
Atrapados en la red??

“Mi marido es adicto a Twitter y a la luz roja de la Blackberry”, decía preocupada una mujer. En cualquier lugar y a cualquier hora, enviaba tuits compulsivamente, y consultaba sin parar sus menciones e interacciones en Twitter. Miraba continuamente de reojo la Blackberry, por si se había encendido la luz roja, avisando de un nuevo mensaje.
¿Existe la adicción a Internet y a las redes sociales? Según un estudio de la Universidad de Chicago, realizado con 205 personas, Facebook y Twitter son más adictivos que los cigarrillos o el alcohol. La conclusión de Wilhelm Hofmann, responsable de esta investigación, es que el deseo de usar las redes sociales es más difícil de resistir que el de fumar o beber alcohol, porque las redes sociales están más fácilmente disponibles, y porque existe la sensación de que el precio de engancharse a ellas es bajo.
¿Puede estar un día sin entrar en Twitter o Facebook? ¿Descuida su trabajo o sus obligaciones familiares por estar demasiado tiempo en Internet? ¿Está más pendiente de sus “amigos virtuales” que de los reales?
En muchos casos, el problema puede surgir por no saber desconectar, y estar constantemente pendiente delsmartphone, para ver qué recibo y qué respondo. Algunos altos ejecutivos de empresas tecnológicas de Silicon Valley (EEUU) declaraban recientemente al New York Times su preocupación por las consecuencias negativas que esto puede generar.
Stuart Crabb, uno de los directores ejecutivos de Facebook, aconseja desconectar y dejar de usar, de vez en cuando, los ordenadores y smartphones. Richard Fernández, ejecutivo de Google, señala que los riesgos de estar demasiado “enganchado” a los dispositivos electrónicos son grandes. Según él, “los consumidores necesitan una brújula interna para saber equilibrar las capacidades que la tecnología les ofrece para trabajar y buscar, y la calidad de la vida que vivenoffline”.
Por su parte, Kelly McGonigal, psicóloga de la Universidad de Standford, cree que los aparatos interactivos pueden generar una sensación permanente de emergencia, activando mecanismos de estrés en el cerebro: “La gente no se considera adicta, pero sí atrapada”.
Satisfacción rápida y sin esfuerzo
Una adicción es la repetida vivencia de una necesidad imperiosa, difícilmente evitable, de consumir o hacer algo. Supone la pérdida del control sobre un determinado comportamiento, aun siendo consciente de las consecuencias negativas que pueda tener dicha actuación. El riesgo de desarrollar una dependencia de este tipo está en función de lo adictiva que sea la sustancia o la conducta, las características de la personalidad de cada uno, y el ambiente que rodea a la persona.
El doctor Javier Cabanyes, del departamento de Neurología de la Clínica Universitaria de Navarra, afirma que “Internet y las redes sociales pueden tener un alto poder adictivo, ya que producen satisfacciones en diferentes campos –conocimiento, curiosidad, estética, emociones, apoyos, sexualidad–; lo hacen de forma rápida y sin esfuerzo; pueden evitar insatisfacciones –inseguridad, temor, timidez, vergüenza–; y permiten hacerlo desde un mundo de deseos y fantasías autoconstruido, elaborado a medida”.
Si quien hace uso de Internet y las redes sociales “no tiene el suficiente autocontrol –por edad, por deficiente configuración de la personalidad, o por problemas añadidos como la soledad, baja autoestima, marginación, conflictividad familiar o social, etcétera–, el riesgo de adicción es mayor, al confluir un alto poder adictivo con escasos recursos de control personal”.
Algunos síntomas
A diferencia del mero usuario, la persona adicta a Internet o a las redes sociales se va focalizando cada vez más en esa actividad, va perdiendo otros intereses, y nada le atrae más que estar conectado. Al mismo tiempo, descuida o abandona otras actividades –estudio, trabajo, obligaciones familiares–; pierde relaciones personales, abandona otros intereses –deporte, formación personal, participación en eventos sociales fuera del ámbito cibernético–; y se va alejando progresivamente del mundo real.
Al consolidarse la adicción, la persona afectada necesita dedicar cada vez más tiempo e intensidad a esa actividad, para conseguir lo que antes lograba con menos. “La persona –añade Cabanyes– experimenta un marcado desasosiego, irritabilidad e incluso malestar físico cuando no está llevando a cabo esas actividades, lo que le potencia la necesidad imperiosa de realizarlas”.
Un caso real: un joven de veinte años fue abandonando progresivamente sus estudios universitarios, restringiendo las relaciones con sus amigos y la vida familiar, para encerrarse cada vez más en su habitación y ocuparse de sublog sobre balonmano. A través de dicho blog, había ido contactando con muchas personas que le seguían y le hacían preguntas, pues el joven poseía amplios conocimientos sobre ese deporte. El doctor Cabanyes explica que “la intervención terapéutica no fue fácil, pero finalmente se logró que superara la inseguridad que tenía de fondo, compensada anómalamente en el mundo virtual, y que desplegara muchas de sus capacidades, abriéndose al mundo real y experimentando, así, más satisfacciones”.
¿Problemas ya existentes?
Según algunas informaciones, la American Psyquiatric Association planea incluir en 2013 el “desorden en el uso de Internet” en el apéndice de su manual de desórdenes mentales, el Diagnostic and Statistical Manual of Mental Disorders, que se considera la obra de referencia en trastornos psíquiátricos.
Sin embargo, no existe una postura unánime sobre este tema, pues algunos autores y estudiosos consideran que no existe la adicción a Internet como tal. Por ejemplo, Vaughan Bell, profesor del Instituto de Psiquiatría del King’s College de Londres, considera que “la gente es adicta a sustancias o actividades, no a un medio de comunicación. Decir que soy adicto a Internet es tan absurdo como decir que lo soy a las ondas de radio”.
Como él, varios psicólogos y psiquiatras llevan años estudiando la relación entre interacción social e Internet. Los resultados de Scott Caplan, de la Universidad de Delaware (EEUU), revelan que las personas con ansiedad, depresión y dificultad para socializar tienden a usar más Internet. Según Caplan, la Red no crea patologías, sino que canaliza un problema ya existente.
Sea como fuere, pasar demasiado tiempo en Internet o en las redes sociales puede llevar a descuidar obligaciones; o a dejar en un segundo plano amistades personales, más enriquecedoras que una relación virtual.
Para solucionar el problema de la supuesta adicción a Internet, Javier Cabanyes considera que “es necesario potenciar el autocontrol, asumir la realidad, dar un sentido más hondo a la vida y disponer de verdaderos apoyos sociales”.
Respecto a la prevención, es una cuestión educativa: procede de educar el control personal y proponer razones para ello: “Los padres han de educar en el sentido de los límites, con modelos atractivos y coherentes. La escuela debe ser un refuerzo en la misma línea, y un ámbito de desarrollo personal y de habilidades sociales.”
Es evidente que Internet ha supuesto una revolución en el acceso a la información y al conocimiento, con claros beneficios para la humanidad. Pero como cualquier otra herramienta, enriquece o empobrece según el uso que se le dé, del cómo y el para qué.
¿Internet nos hace superficiales?
Sin llegar al extremo de la adicción, Internet y las redes sociales también pueden generar distracción y superficialidad. El escritor estadounidense Nicholas Carr, autor del libro Superficiales. ¿Qué está haciendo Internet con nuestras mentes?, afirma que “Internet alienta la multitarea y fomenta muy poco la concentración. Cuando abres un libro, te aíslas de todo porque no hay nada más que sus páginas. Cuando enciendes el ordenador, te llegan mensajes de todas partes, es una máquina de interrupciones constantes”.
En declaraciones a El País, Carr reconoce que Internet aporta muchas cosas positivas: “Nos permite mostrar nuestras creaciones, compartir pensamientos, estar en contacto con los amigos, y hasta nos ofrece oportunidades laborales”. Internet y las nuevas tecnologías “están teniendo tanto efecto en nuestra forma de pensar porque son útiles, entretenidas y divertidas. Si no lo fueran, no nos sentiríamos tan atraídos por ellas”.
Sin embargo, este autor considera que “nos estamos dirigiendo hacia un ideal muy utilitario, donde lo importante es lo eficiente que uno es procesando información, y donde deja de apreciarse el pensamiento contemplativo, abierto, que no necesariamente tiene un fin práctico y que, sin embargo, estimula la creatividad”.
Para Carr, la capacidad para concentrarse en una sola cosa “es clave en la memoria a largo plazo, en el pensamiento crítico y conceptual, y en muchas formas de creatividad. Incluso las emociones y la empatía precisan de tiempo para ser procesadas. Si no invertimos ese tiempo, nos deshumanizamos cada vez más”.
PD3: El tópico, los niños son carísimos. Y tanto. Te lo digo yo que cuento con 9 y les mando a colegios privados y alguno me cae en Universidad privada también… Y gracias a contar con el Título de Familia Numerosa que si no, no sé qué sería de nosotros…


Te sugiero que entres en la calculadora financiera de Fidelity para que te hagas una estimación tuya personal, con tus propios datos y fechas de nacimiento de tus hijos… Y la cantidad de alegrías que nos dan los angelitos… Cuando son mayores no tantas, que al final fuman, se emborrachan, van con mujeres y todo… No, son muy buenos y merecen la pena…
PD4: Estamos de enhorabuena. Mi hijo mayor se ha colocado. Tras un mes de paro ha empezado a trabajar. Ha tenido mucha suerte. Le han cogido en un family office grande para gestionar carteras de las familias. Buen sitio y con proyección. Estamos encantados y damos muchas gracias a Dios. Él está encantando, se pellizca…, impresionado con su suerte. Ha tenido muchas entrevistas gracias a todos vosotros y vuestra generosidad. Al final consiguió el trabajo gracias a su CV echado en Linkedin… ¡Ay que joderse! Ya no funcionan las relaciones personales y sí las de las redes… Bueno a lo que voy, yo creo que se ha colocado por su buen curriculum que tenía, sobre todo, por el aspecto humano que presentaba: había sido catequista 3 años en la iglesia de cerca de casa!!! Se lo propusimos su madre y yo, hay que devolver a la sociedad lo que nos ha dado, y se apuntó. Tenía 18, 19 y 20 años, un lío de pelotas, haciendo la carrera ganando cursos (la acabó en 4 años en vez de en 5), y jugando al rugby y entrenando casi todos los días. Estiró el tiempo hasta el límite. Y atendió a su clase semanal de catequesis, con chicos de 7 años, que vio crecer en esos tres años hasta que los soltó cuando hicieron la Primera Comunión… Se quedó exhausto. Seguro que él tiene razón cuando me decía que no lo quería poner en el CV dada la poca afición religiosa española. Y seguro que no le han cogido por eso. Creo que el motivo, aparte de que en la entrevista ganaba muchos puntos por ser un tipo simpático y educado, es que el Consejero Delegado era jugador de rugby, y entre aficionados se apoyan… Yo creo que no, Dios le pagó el esfuerzo catequético con un buen trabajo. Gracias Dios mío por habérmelo dejado en España y que pueda disfrutar de él… Difiero a la mentalidad americana de ver como se largan de casa a los 18 para siempre, salvo thanskgiving. Yo me los quedaría cerca siempre…